 12
12peptides
spectra
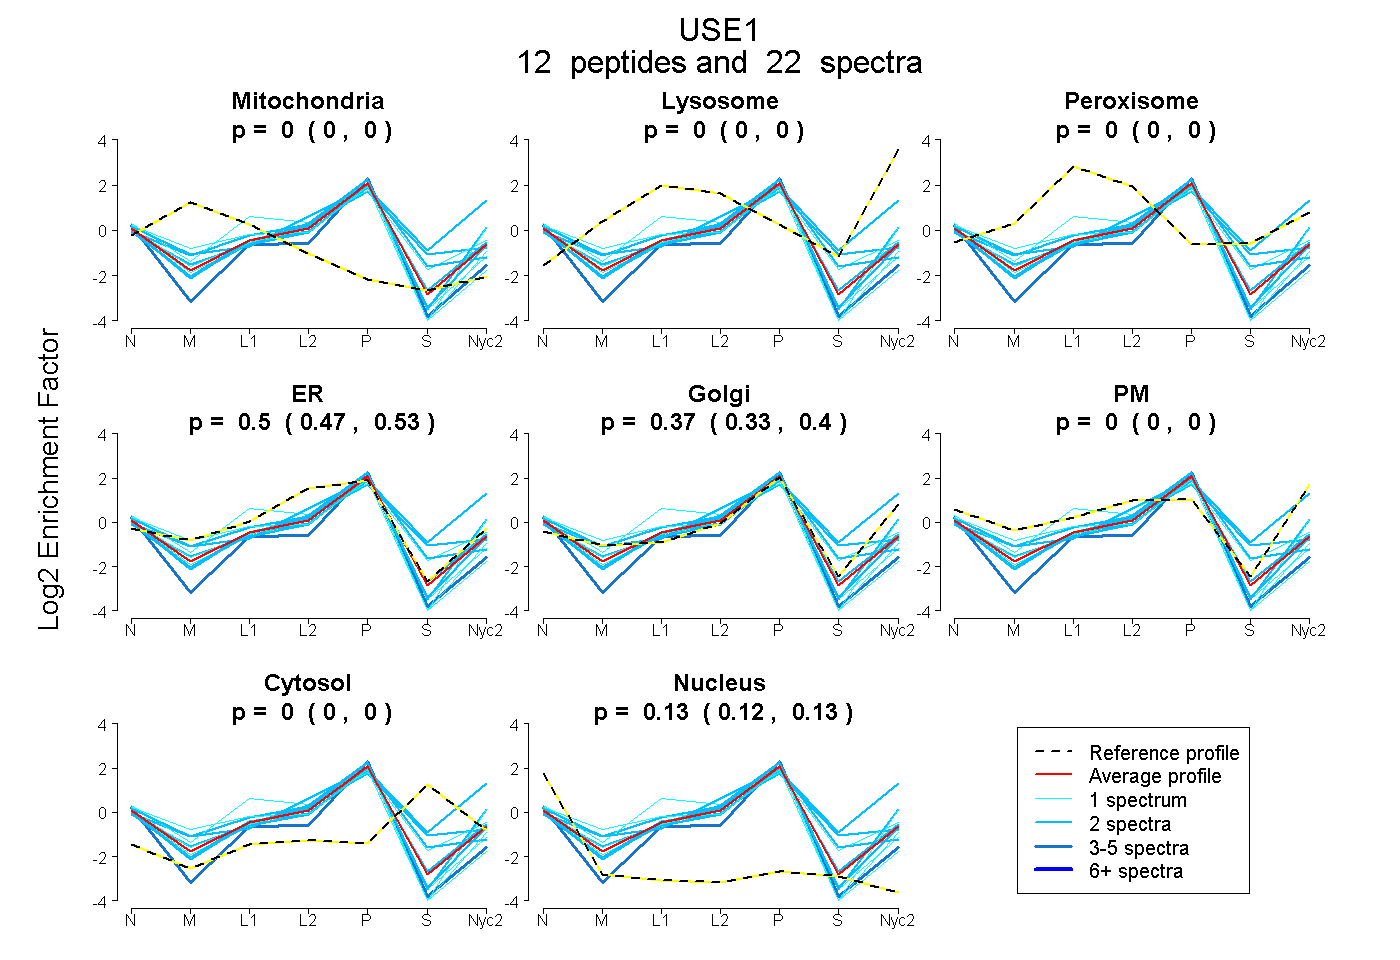
0.000 | 0.000
0.000 | 0.000
0.000 | 0.000
0.471 | 0.530
0.331 | 0.402
0.000 | 0.000
0.000 | 0.000
0.119 | 0.135
2peptides
spectra
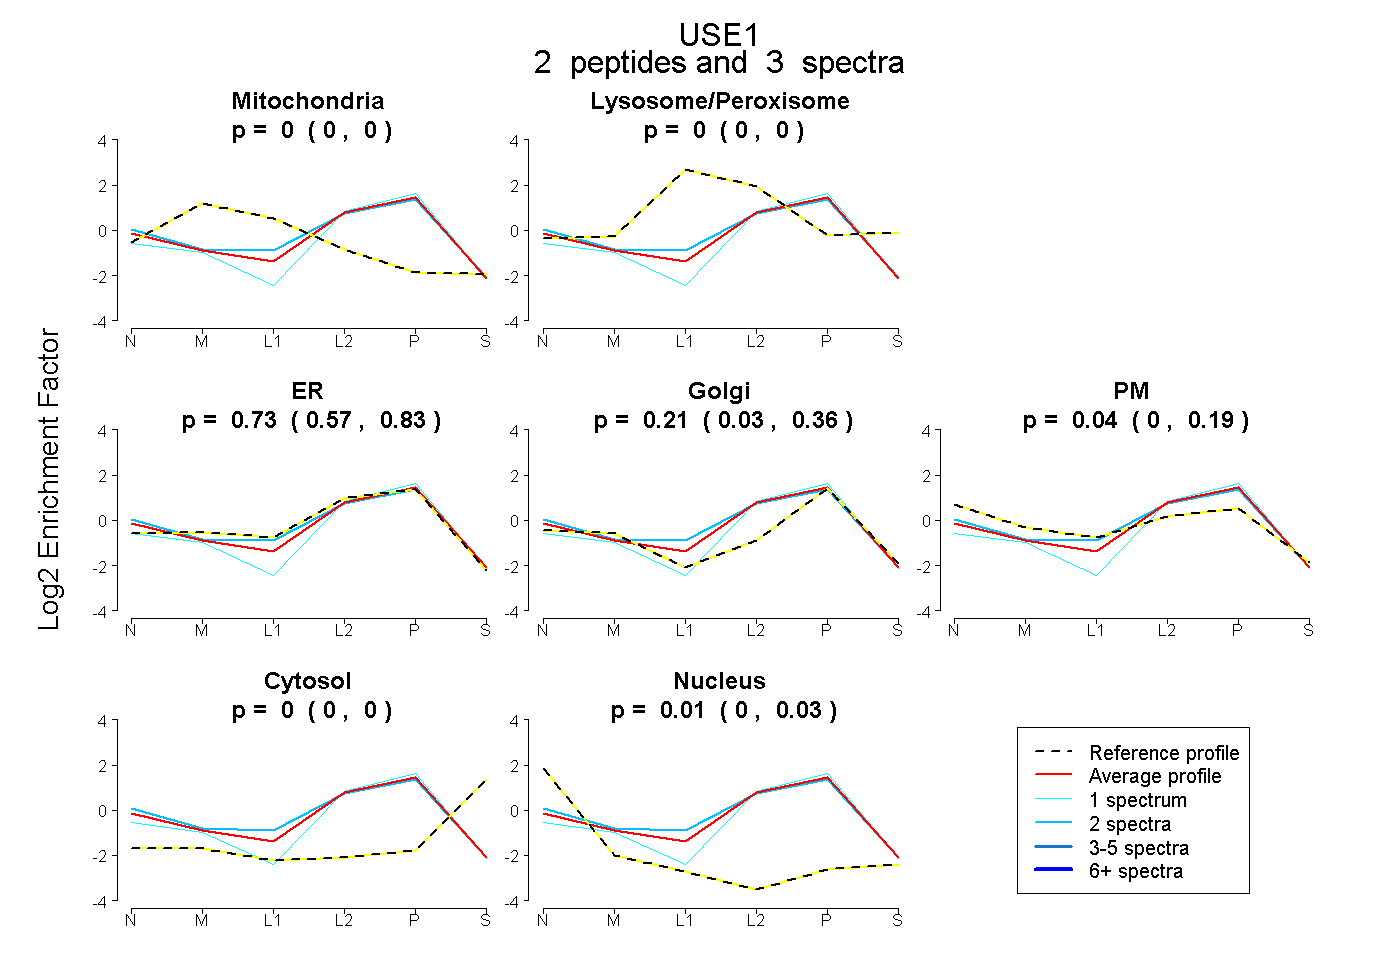
0.000 | 0.000
0.000 | 0.000
0.570 | 0.834
0.028 | 0.359
0.000 | 0.188
0.000 | 0.000
0.000 | 0.033
4peptides
spectra
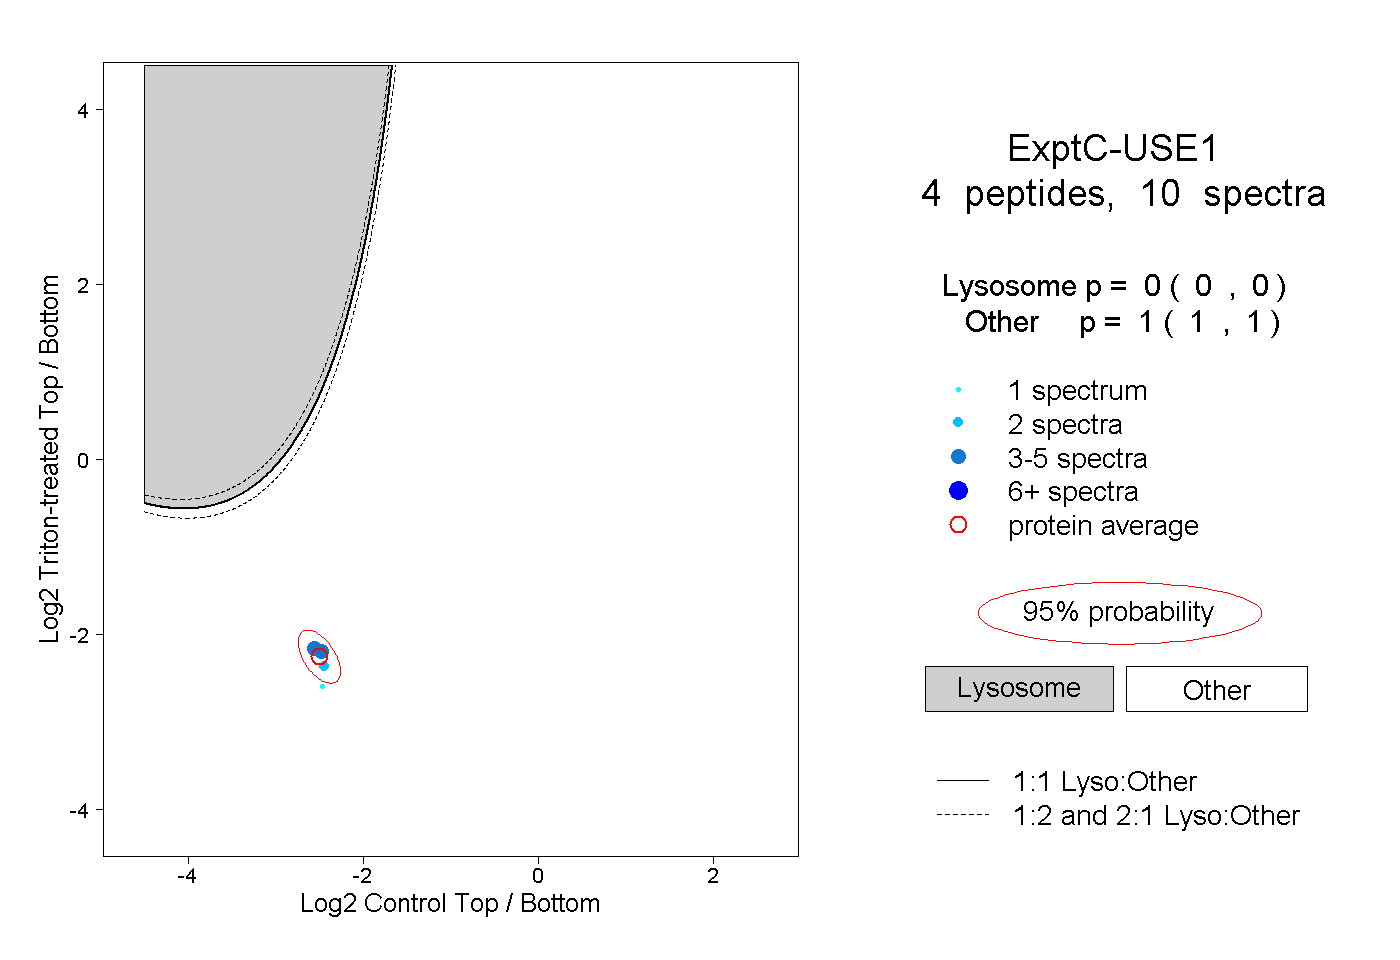
0.000 | 0.000
1.000 | 1.000