 12
12peptides
spectra
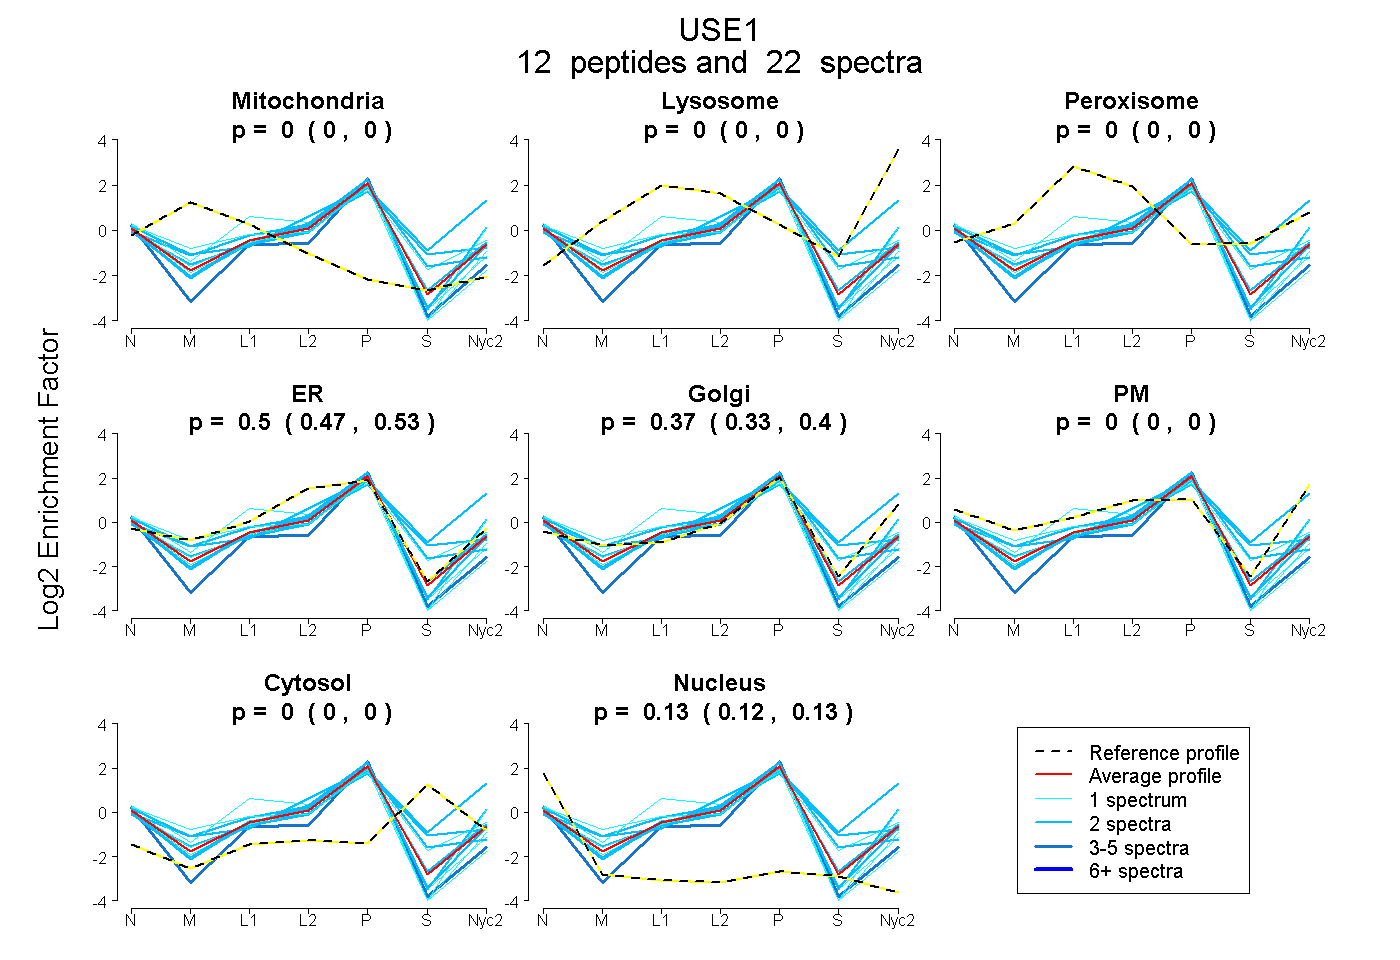
0.000 | 0.000
0.000 | 0.000
0.000 | 0.000
0.471 | 0.530
0.331 | 0.402
0.000 | 0.000
0.000 | 0.000
0.119 | 0.135
| Plot | Mito | Lyso | Perox | ER | Golgi | PM | Cytosol | Nucleus | |||||
| Expt A |
12 peptides |
22 spectra |
|
0.000 0.000 | 0.000 |
0.000 0.000 | 0.000 |
0.000 0.000 | 0.000 |
0.503 0.471 | 0.530 |
0.370 0.331 | 0.402 |
0.000 0.000 | 0.000 |
0.000 0.000 | 0.000 |
0.127 0.119 | 0.135 |
| 2 spectra, YVGALEDMLQALK | 0.000 | 0.000 | 0.000 | 0.544 | 0.329 | 0.000 | 0.000 | 0.127 | ||
| 1 spectrum, VPTTAK | 0.026 | 0.000 | 0.000 | 0.360 | 0.480 | 0.074 | 0.000 | 0.059 | ||
| 1 spectrum, EPDEWR | 0.000 | 0.000 | 0.000 | 0.620 | 0.207 | 0.000 | 0.000 | 0.173 | ||
| 2 spectra, LELNLVR | 0.000 | 0.000 | 0.000 | 0.527 | 0.227 | 0.000 | 0.141 | 0.106 | ||
| 2 spectra, GPRPADEK | 0.000 | 0.074 | 0.000 | 0.000 | 0.658 | 0.082 | 0.186 | 0.000 | ||
| 5 spectra, ALANQFLAPGR | 0.000 | 0.000 | 0.000 | 0.474 | 0.260 | 0.000 | 0.000 | 0.266 | ||
| 2 spectra, LAEEMLGLAR | 0.000 | 0.000 | 0.000 | 0.372 | 0.564 | 0.000 | 0.000 | 0.065 | ||
| 1 spectrum, QSASELDLVLQR | 0.000 | 0.000 | 0.000 | 0.635 | 0.219 | 0.000 | 0.000 | 0.146 | ||
| 1 spectrum, HQGLQEK | 0.000 | 0.000 | 0.132 | 0.548 | 0.201 | 0.000 | 0.054 | 0.065 | ||
| 1 spectrum, VQASKPASEVISEYSR | 0.000 | 0.000 | 0.000 | 0.782 | 0.000 | 0.000 | 0.000 | 0.218 | ||
| 2 spectra, DNQTLSHSLK | 0.000 | 0.000 | 0.000 | 0.635 | 0.104 | 0.000 | 0.255 | 0.007 | ||
| 2 spectra, LEQHAQK | 0.000 | 0.000 | 0.000 | 0.636 | 0.261 | 0.000 | 0.000 | 0.103 |
| Plot | Mito | Lyso or Perox | ER | Golgi | PM | Cytosol | Nucleus | ||||||
| Expt B |
2 peptides |
3 spectra |
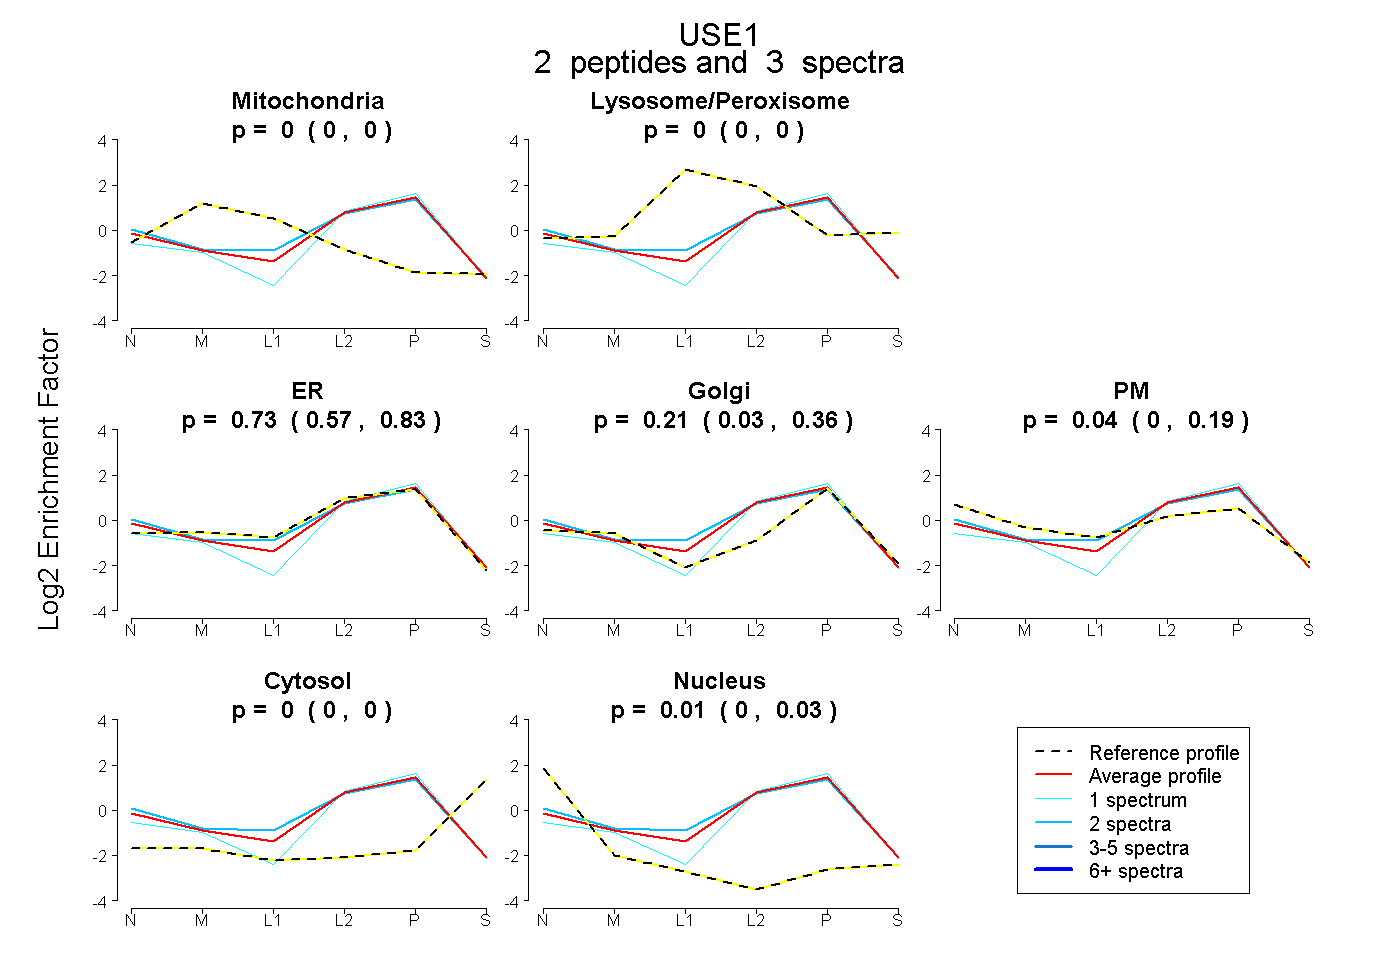 |
0.000 0.000 | 0.000 |
0.000 0.000 | 0.000 |
0.735 0.570 | 0.834 |
0.210 0.028 | 0.359 |
0.043 0.000 | 0.188 |
0.000 0.000 | 0.000 |
0.012 0.000 | 0.033 |
|||
| Plot | Lyso | Other | |||||||||||
| Expt C |
4 peptides |
10 spectra |
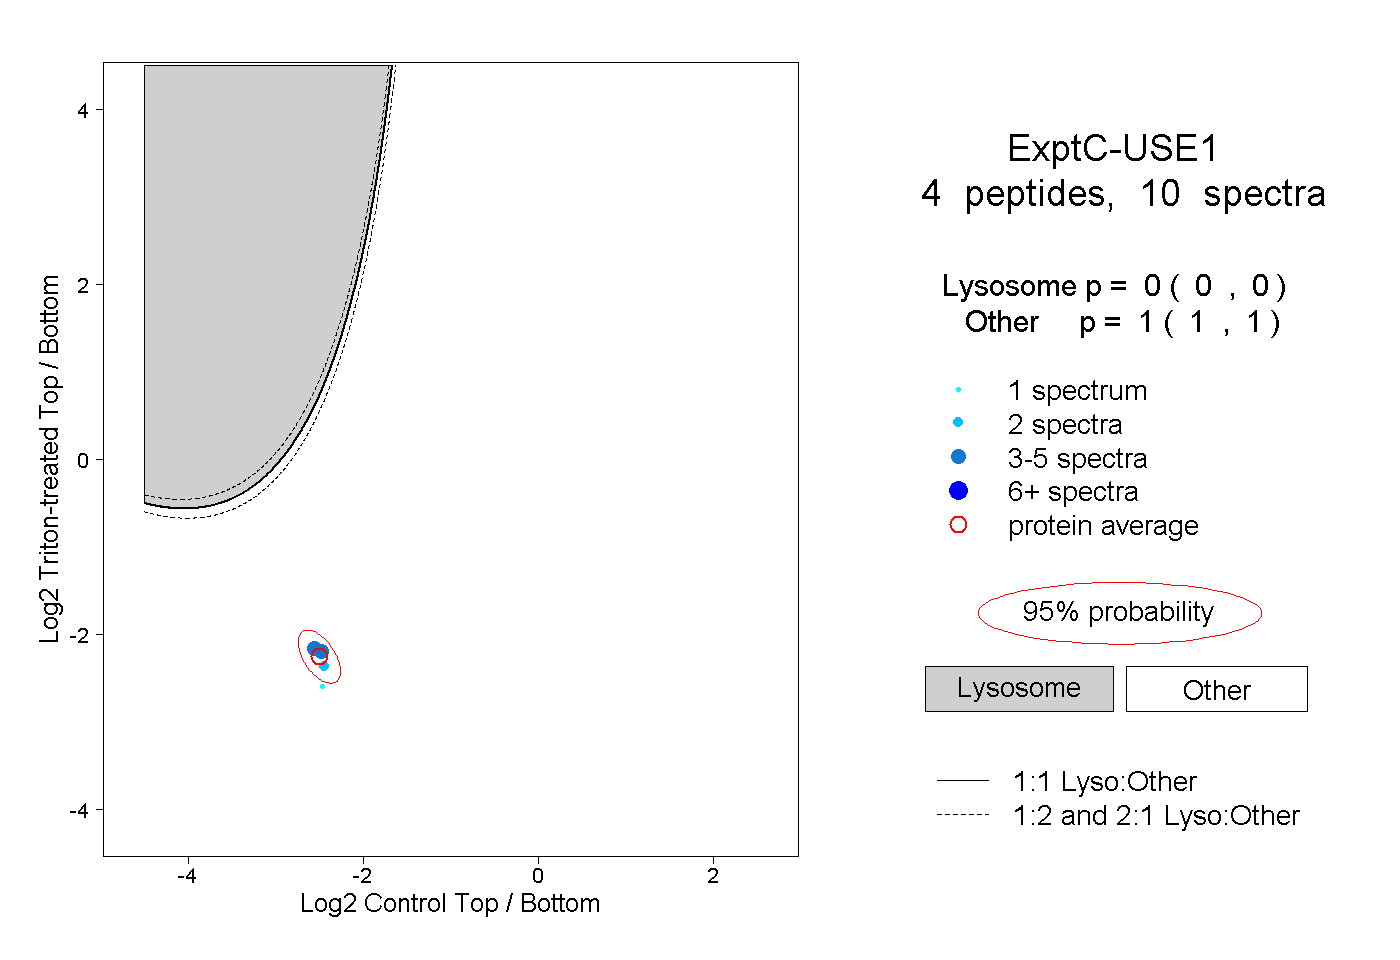 |
0.000 0.000 | 0.000 |
1.000 1.000 | 1.000 |