 20
20peptides
spectra
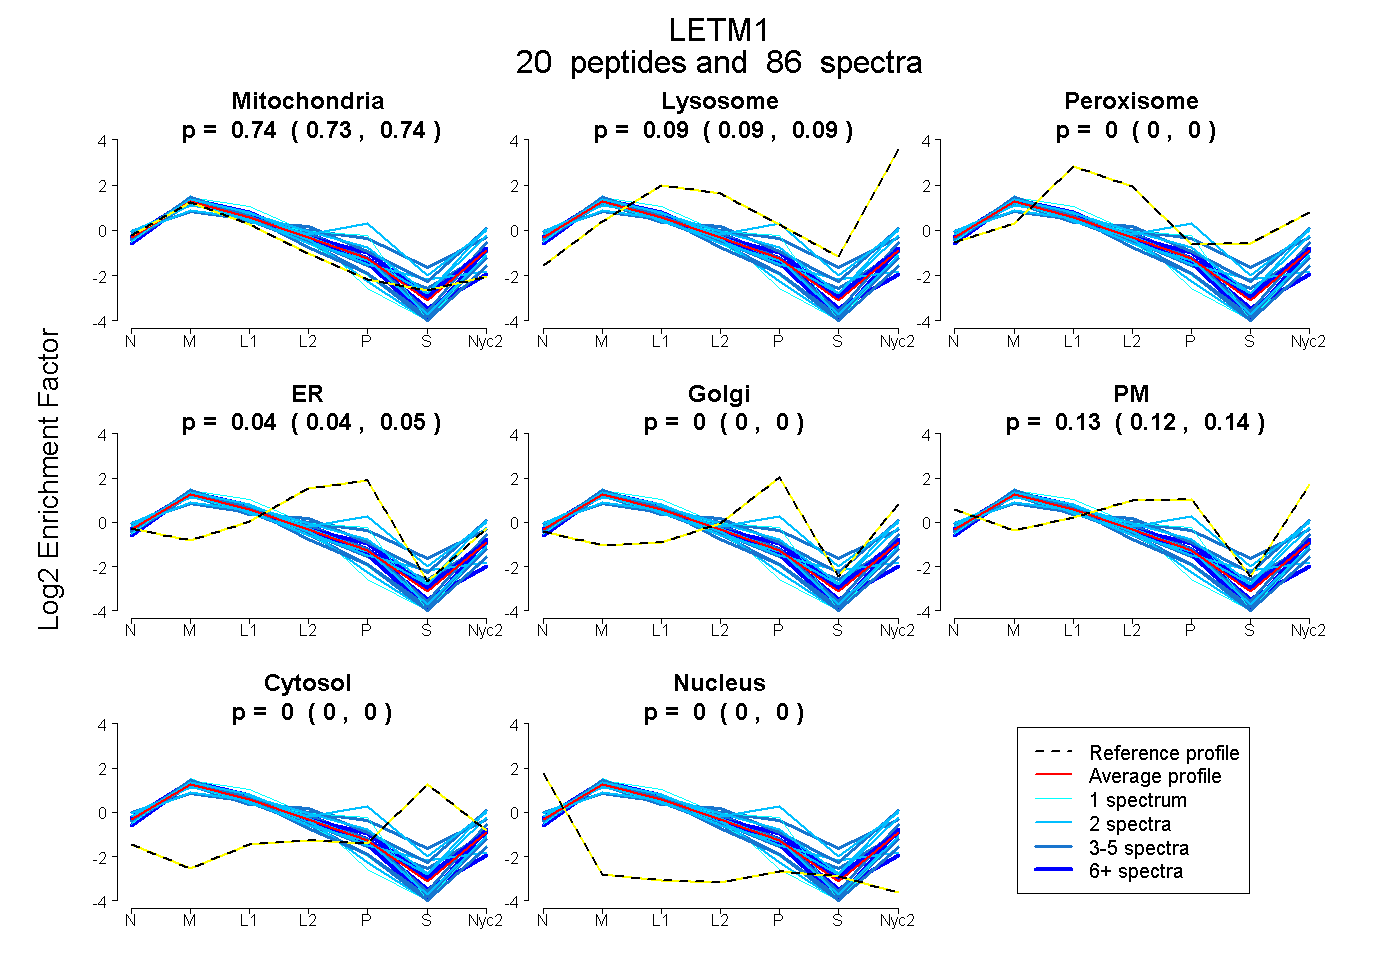
0.733 | 0.741
0.086 | 0.094
0.000 | 0.000
0.035 | 0.052
0.000 | 0.000
0.118 | 0.135
0.000 | 0.000
0.000 | 0.000
15peptides
spectra
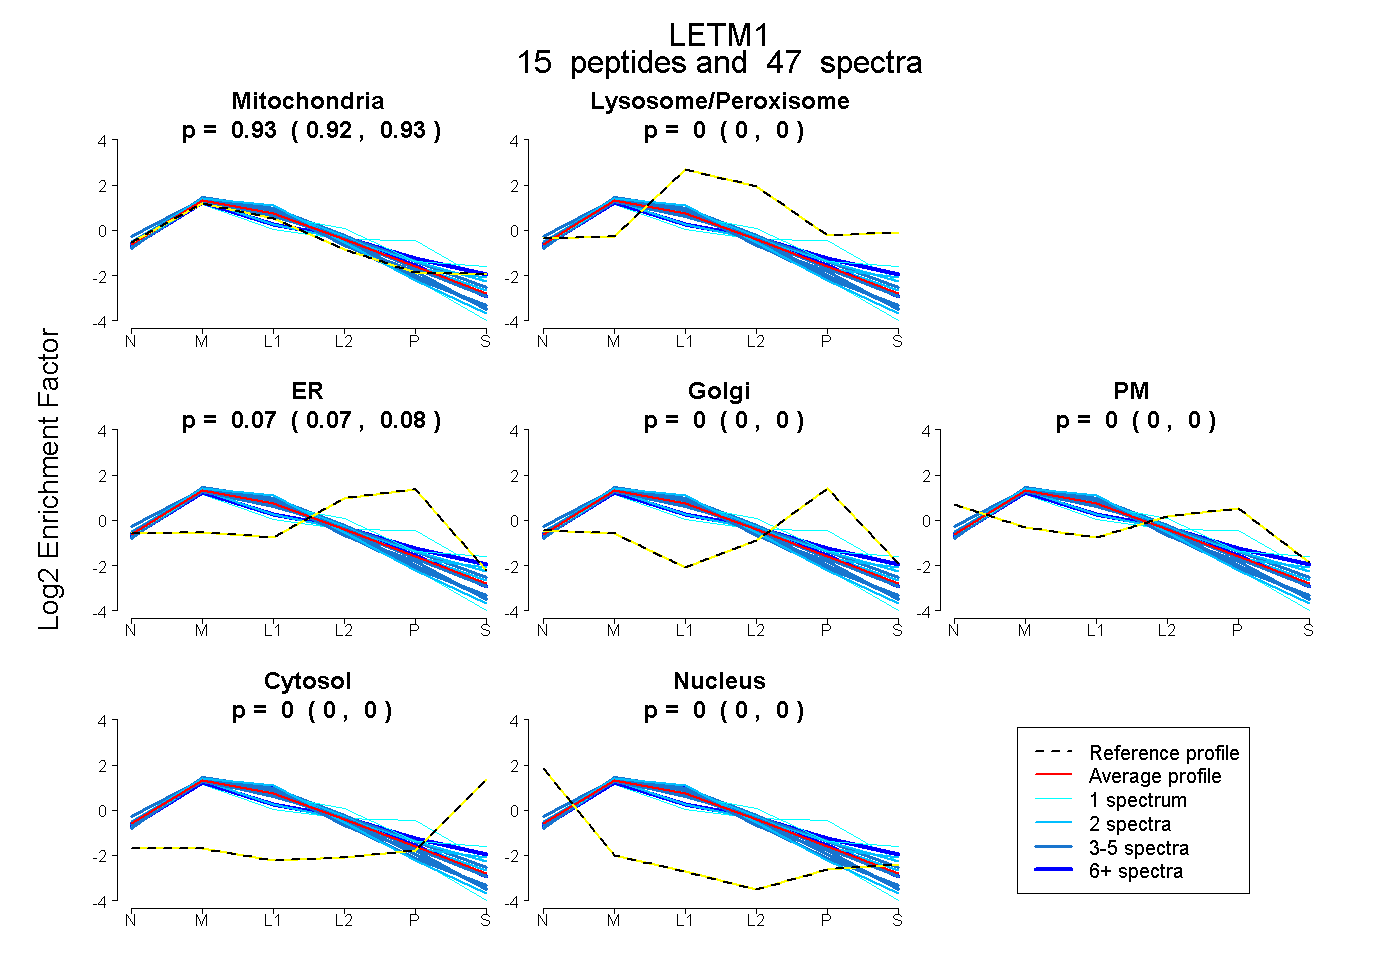
0.920 | 0.930
0.000 | 0.000
0.070 | 0.079
0.000 | 0.000
0.000 | 0.000
0.000 | 0.000
0.000 | 0.000
27peptides
spectra
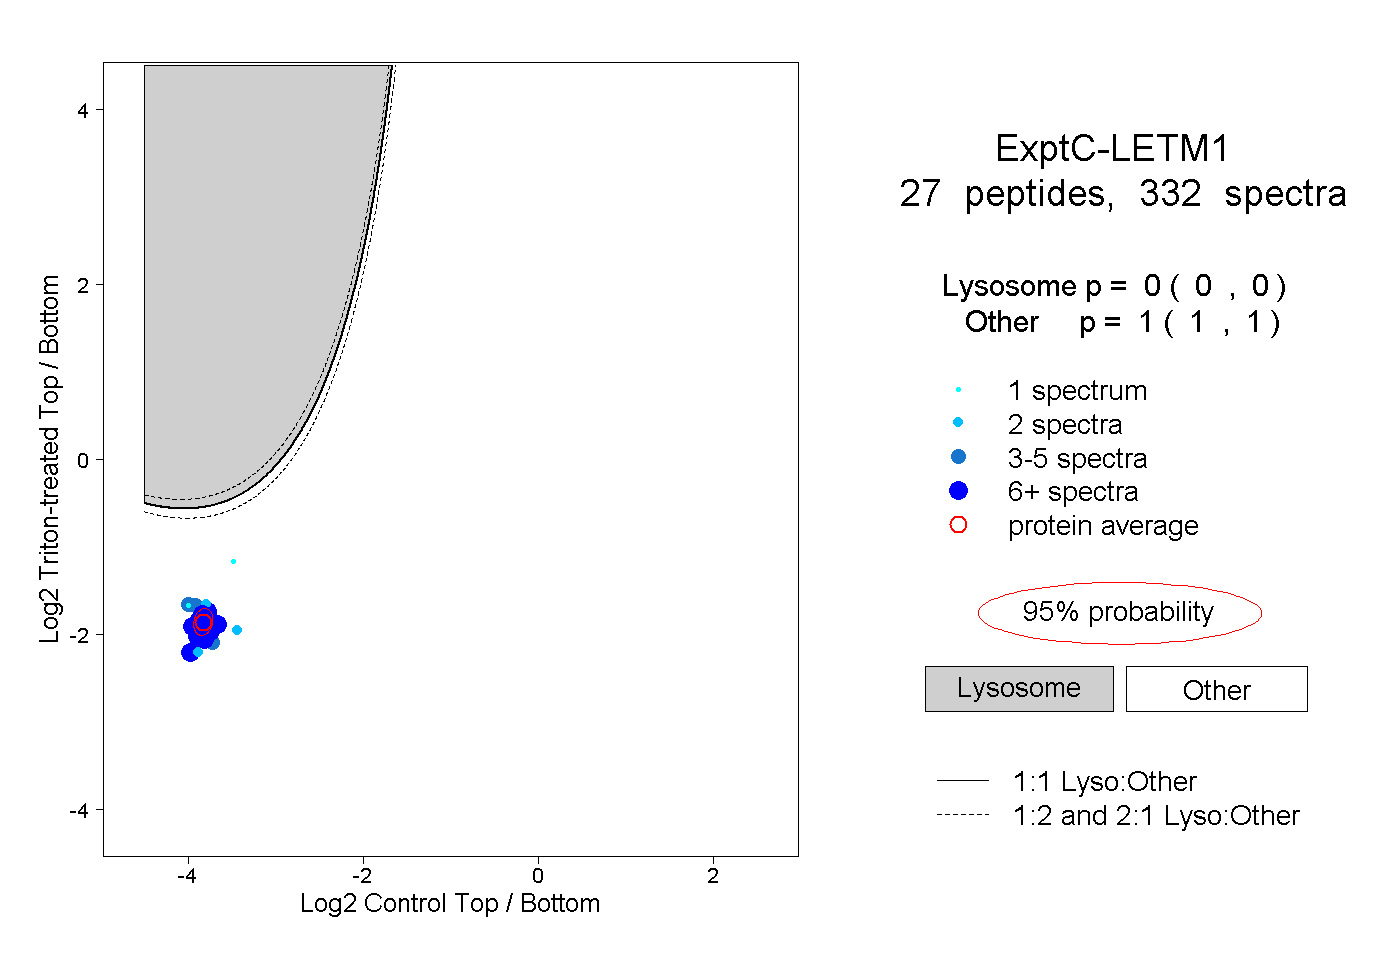
0.000 | 0.000
1.000 | 1.000
14peptides
spectra
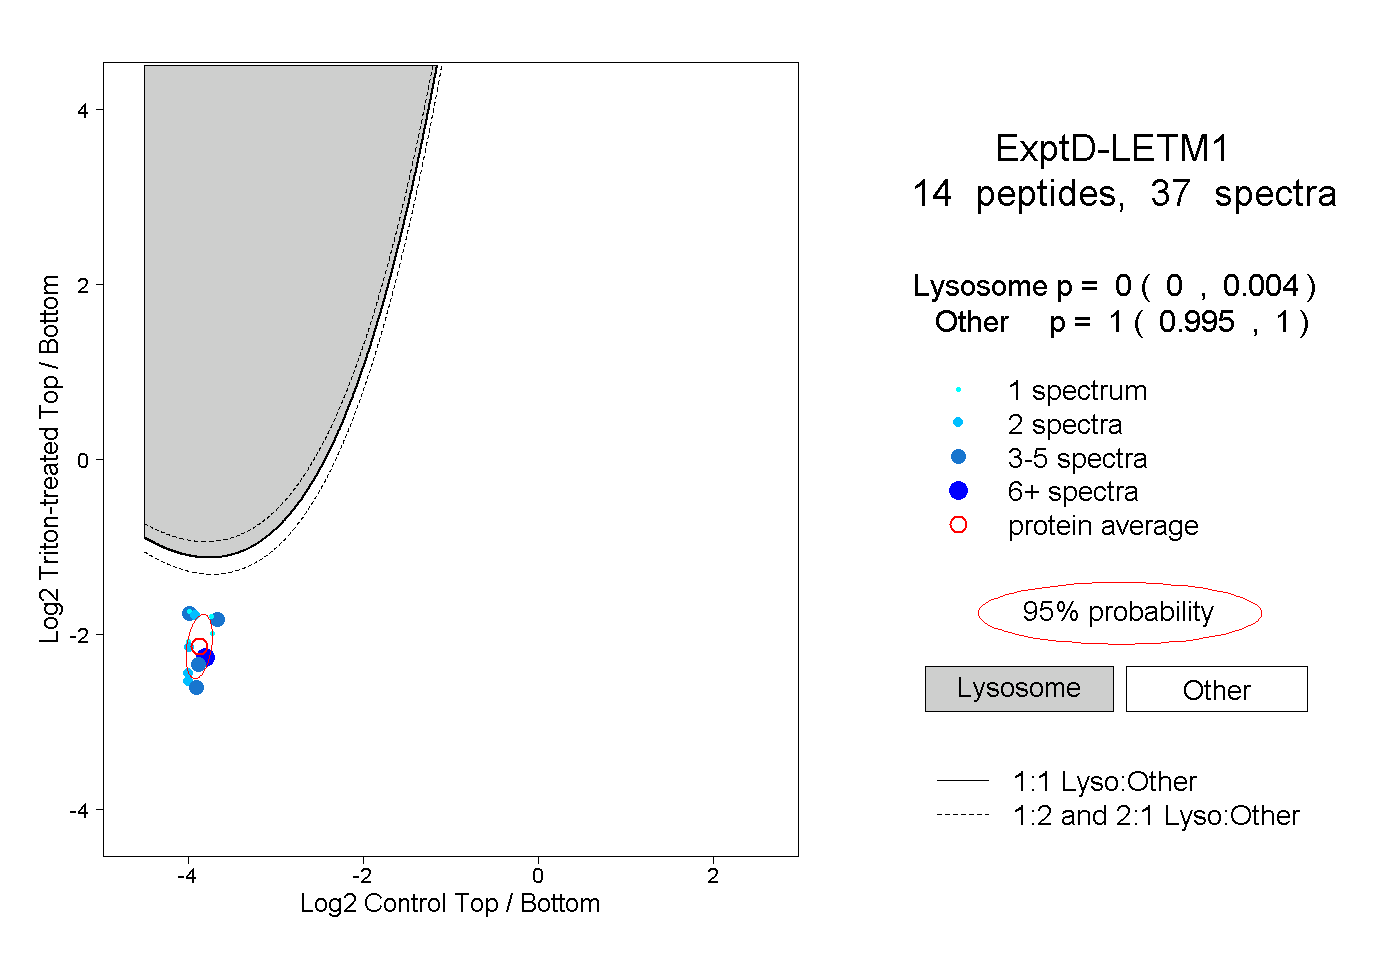
0.000 | 0.004
0.995 | 1.000