 20
20peptides
spectra
0.733 | 0.741
0.086 | 0.094
0.000 | 0.000
0.035 | 0.052
0.000 | 0.000
0.118 | 0.135
0.000 | 0.000
0.000 | 0.000
| Plot | Mito | Lyso | Perox | ER | Golgi | PM | Cytosol | Nucleus | |||||
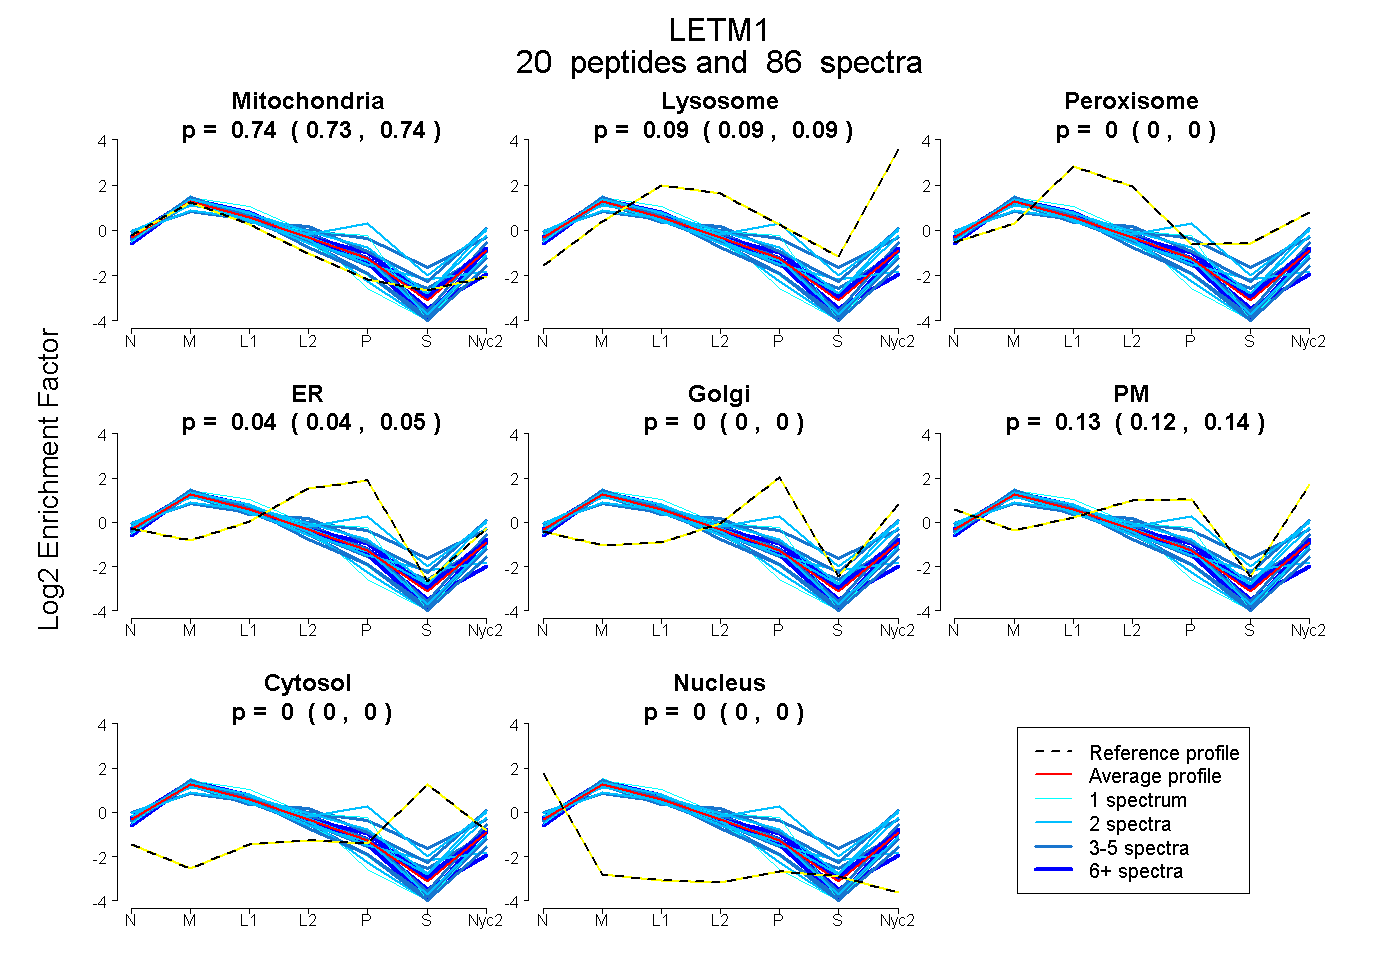
| Expt A |
20 peptides |
86 spectra |
|
0.737 0.733 | 0.741 |
0.090 0.086 | 0.094 |
0.000 0.000 | 0.000 |
0.045 0.035 | 0.052 |
0.000 0.000 | 0.000 |
0.128 0.118 | 0.135 |
0.000 0.000 | 0.000 |
0.000 0.000 | 0.000 |
| 12 spectra, ELQAACR | 0.838 | 0.000 | 0.000 | 0.162 | 0.000 | 0.000 | 0.000 | 0.000 | ||
| 3 spectra, AMYLPDTLSPADQLK | 0.769 | 0.109 | 0.051 | 0.000 | 0.000 | 0.072 | 0.000 | 0.000 | ||
| 4 spectra, LLWIDTK | 0.922 | 0.000 | 0.000 | 0.004 | 0.000 | 0.074 | 0.000 | 0.000 | ||
| 6 spectra, DFSAFFQK | 0.756 | 0.060 | 0.000 | 0.000 | 0.000 | 0.184 | 0.000 | 0.000 | ||
| 5 spectra, ILNGHTLTR | 0.572 | 0.241 | 0.000 | 0.000 | 0.000 | 0.186 | 0.000 | 0.000 | ||
| 1 spectrum, DIQPEVAEATVPGRPGAELQPK | 0.901 | 0.099 | 0.000 | 0.000 | 0.000 | 0.000 | 0.000 | 0.000 | ||
| 2 spectra, LLELQSIGTNNFLR | 0.934 | 0.024 | 0.000 | 0.000 | 0.000 | 0.042 | 0.000 | 0.000 | ||
| 1 spectrum, LEEGGPVYSPPAQVVVK | 0.623 | 0.000 | 0.000 | 0.377 | 0.000 | 0.000 | 0.000 | 0.000 | ||
| 3 spectra, ILDELK | 0.869 | 0.024 | 0.000 | 0.000 | 0.000 | 0.107 | 0.000 | 0.000 | ||
| 13 spectra, FQLTMR | 0.702 | 0.142 | 0.000 | 0.143 | 0.009 | 0.005 | 0.000 | 0.000 | ||
| 2 spectra, STLQTLPEIVAK | 0.763 | 0.060 | 0.000 | 0.091 | 0.000 | 0.086 | 0.000 | 0.000 | ||
| 5 spectra, AAEVEGEQVDNK | 0.440 | 0.000 | 0.229 | 0.000 | 0.170 | 0.148 | 0.013 | 0.000 | ||
| 2 spectra, MVDVIPPSEILK | 0.684 | 0.143 | 0.000 | 0.000 | 0.000 | 0.174 | 0.000 | 0.000 | ||
| 1 spectrum, LISEEGVDSLTVK | 0.871 | 0.079 | 0.000 | 0.000 | 0.000 | 0.050 | 0.000 | 0.000 | ||
| 2 spectra, YIEESTASK | 0.396 | 0.099 | 0.116 | 0.000 | 0.291 | 0.098 | 0.000 | 0.000 | ||
| 6 spectra, ALGVTEDR | 0.748 | 0.113 | 0.000 | 0.000 | 0.000 | 0.139 | 0.000 | 0.000 | ||
| 4 spectra, FLQDTIEEMALK | 0.699 | 0.107 | 0.000 | 0.000 | 0.000 | 0.194 | 0.000 | 0.000 | ||
| 2 spectra, ICADLFR | 0.809 | 0.000 | 0.101 | 0.080 | 0.000 | 0.000 | 0.010 | 0.000 | ||
| 2 spectra, LFPNMLPSTFETQSIK | 0.551 | 0.158 | 0.000 | 0.000 | 0.000 | 0.291 | 0.000 | 0.000 | ||
| 10 spectra, ETGERPSNEEIMR | 0.721 | 0.099 | 0.000 | 0.076 | 0.000 | 0.105 | 0.000 | 0.000 |
| Plot | Mito | Lyso or Perox | ER | Golgi | PM | Cytosol | Nucleus | ||||||
| Expt B |
15 peptides |
47 spectra |
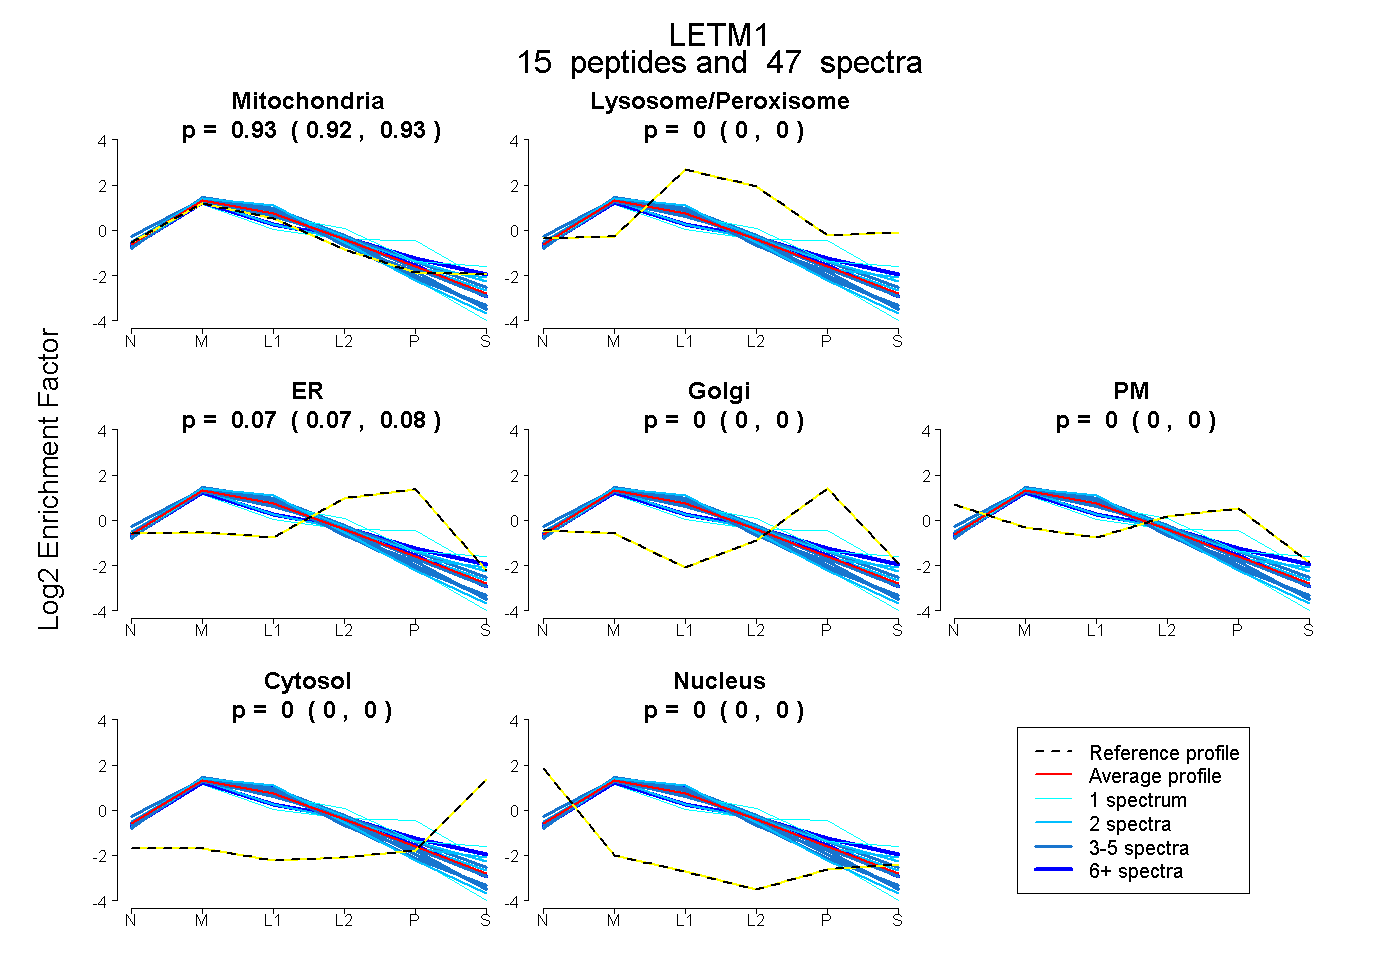 |
0.925 0.920 | 0.930 |
0.000 0.000 | 0.000 |
0.075 0.070 | 0.079 |
0.000 0.000 | 0.000 |
0.000 0.000 | 0.000 |
0.000 0.000 | 0.000 |
0.000 0.000 | 0.000 |
|||
| Plot | Lyso | Other | |||||||||||
| Expt C |
27 peptides |
332 spectra |
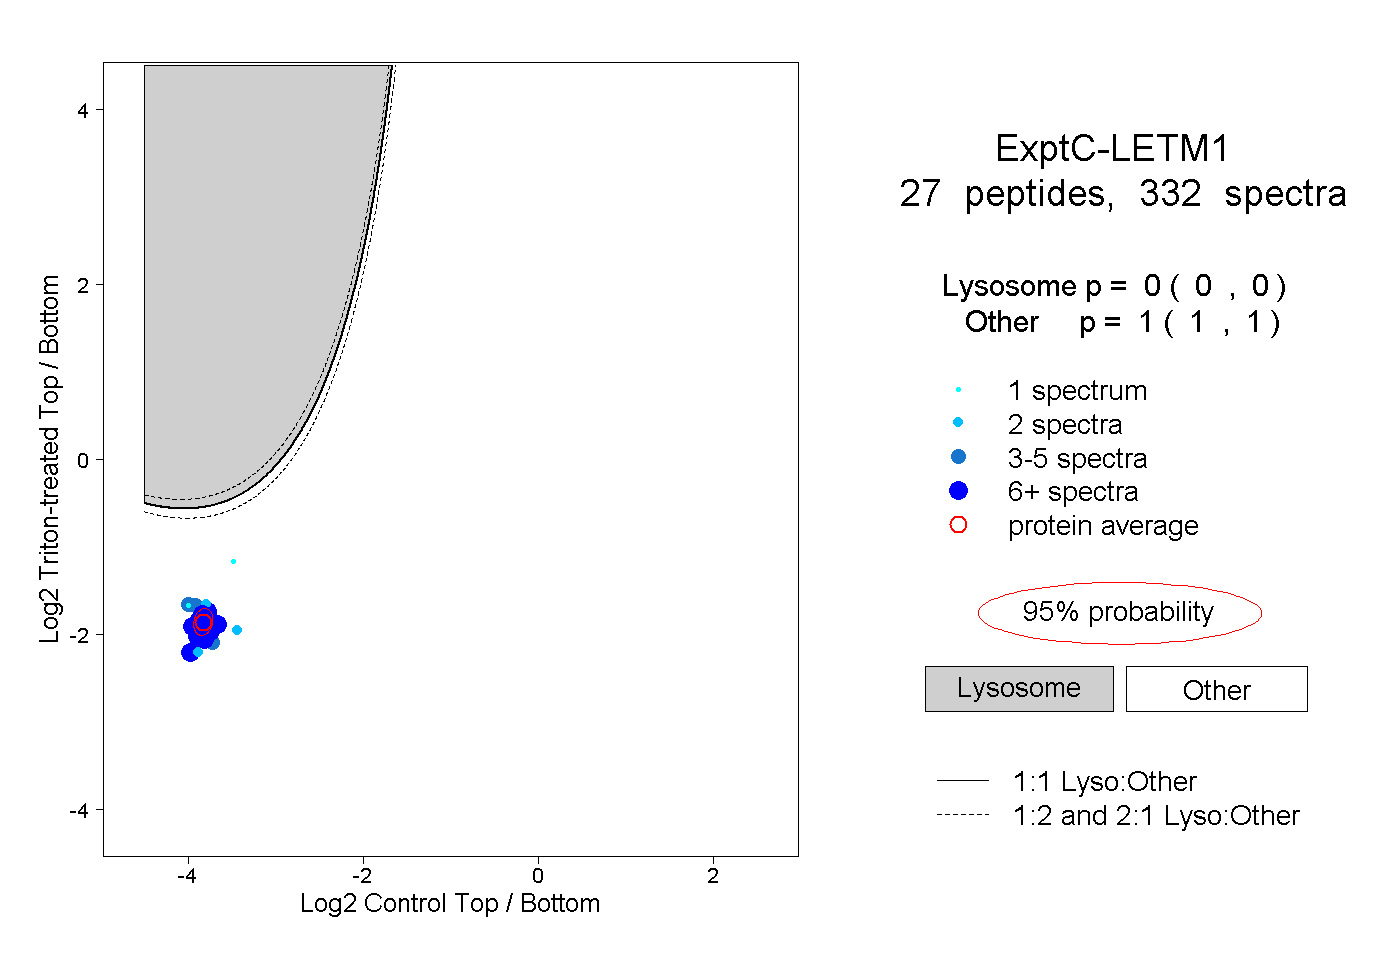 |
0.000 0.000 | 0.000 |
1.000 1.000 | 1.000 |
||||||||
| Plot | Lyso | Other | |||||||||||
| Expt D |
14 peptides |
37 spectra |
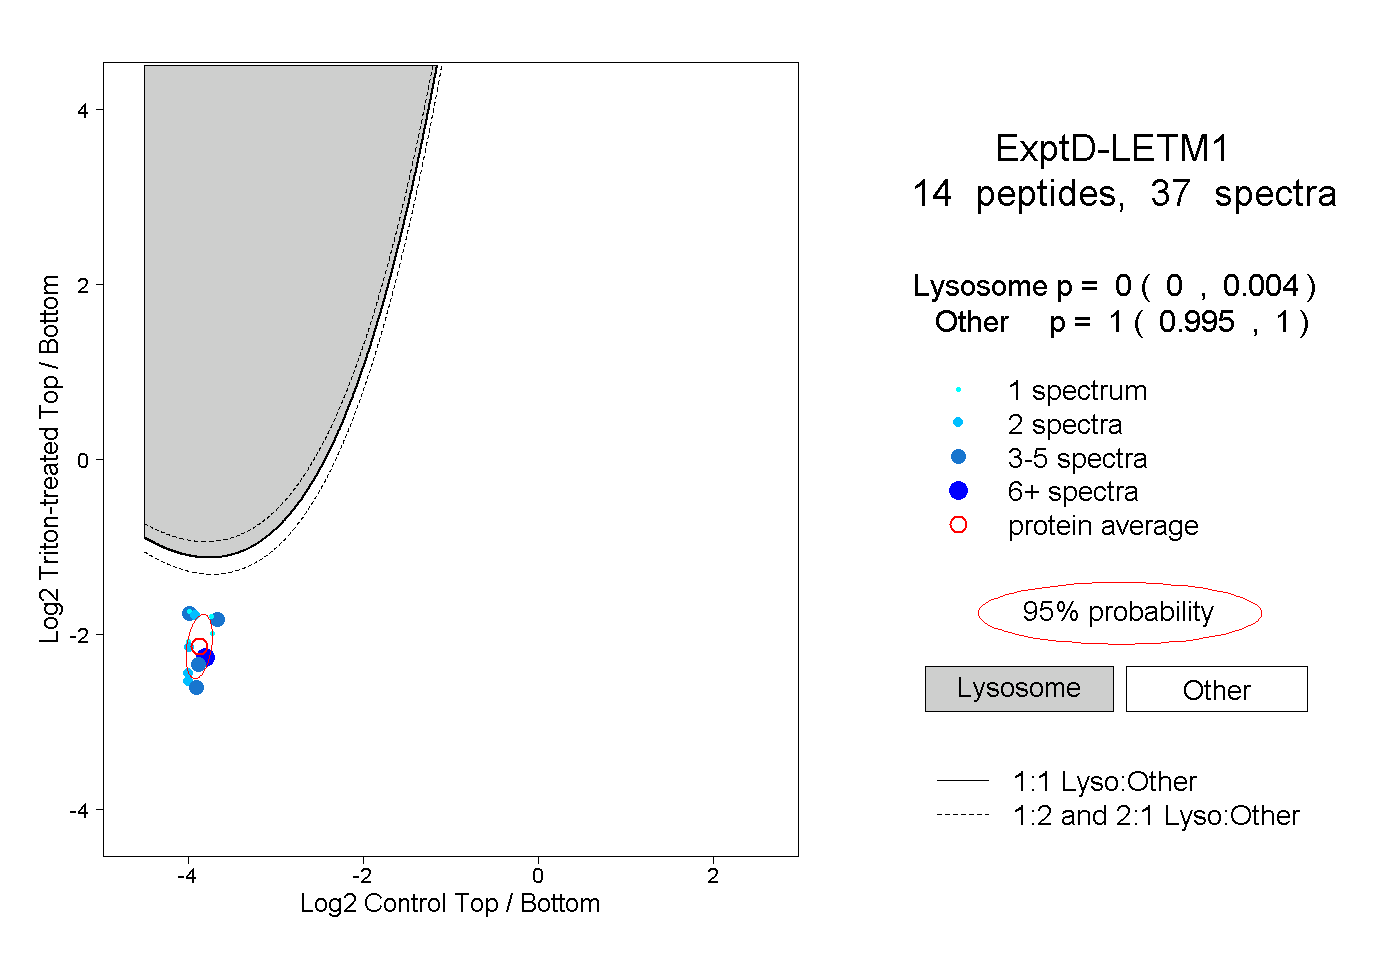 |
0.000 0.000 | 0.004 |
1.000 0.995 | 1.000 |