 16
16peptides
spectra

0.000 | 0.000
0.000 | 0.000
0.051 | 0.066
0.000 | 0.000
0.000 | 0.000
0.619 | 0.642
0.000 | 0.019
0.294 | 0.308
9peptides
spectra
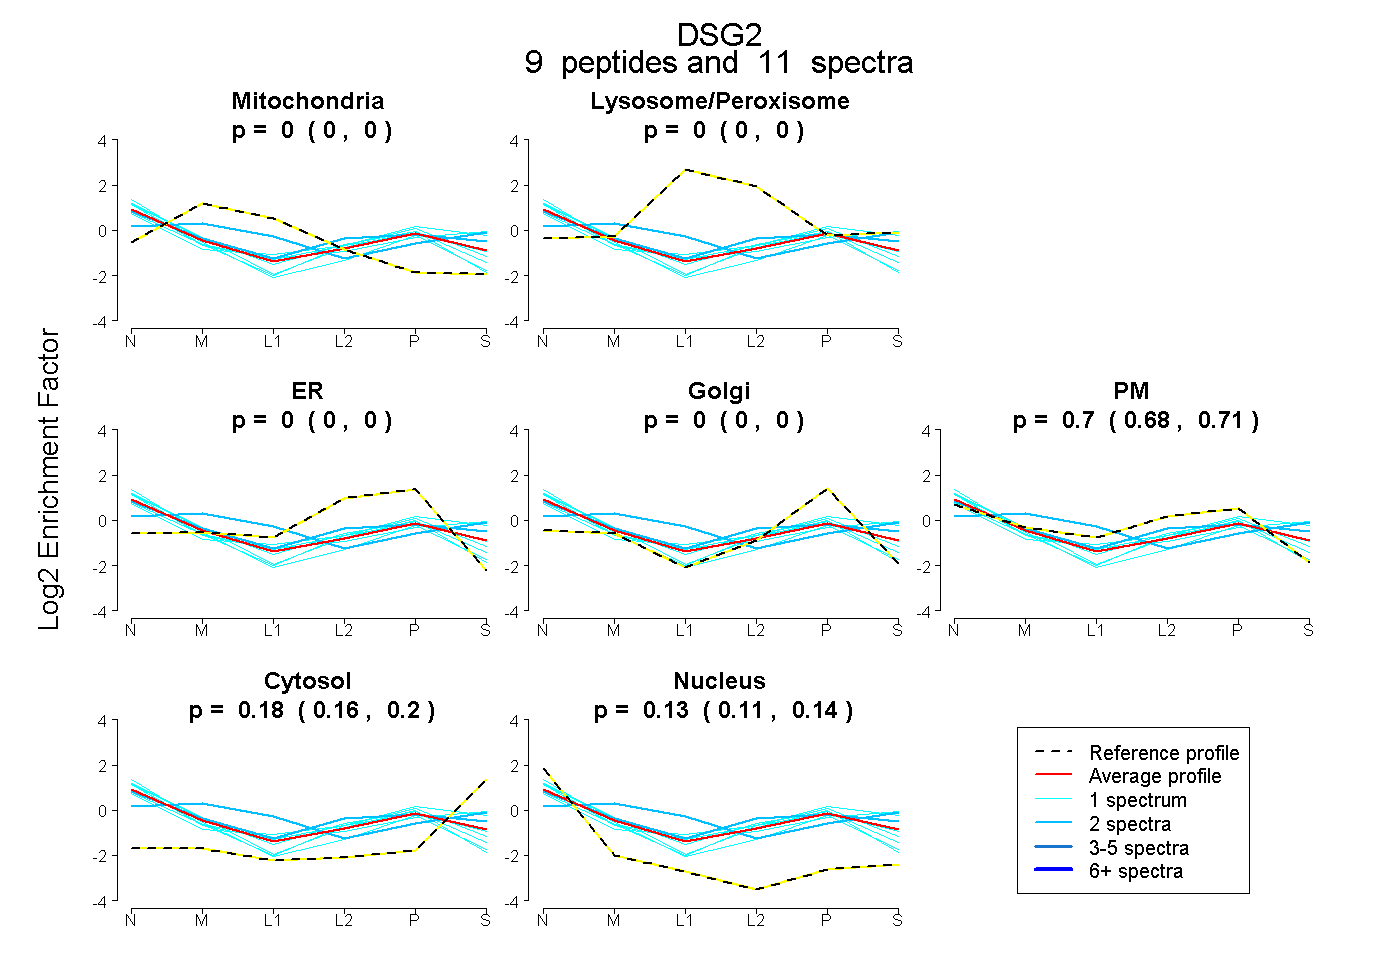
0.000 | 0.000
0.000 | 0.000
0.000 | 0.000
0.000 | 0.000
0.679 | 0.709
0.155 | 0.198
0.109 | 0.141
19peptides
spectra

0.000 | 0.000
1.000 | 1.000
3peptides
spectra

0.000 | 0.000
1.000 | 1.000