 16
16peptides
spectra

0.000 | 0.000
0.000 | 0.000
0.051 | 0.066
0.000 | 0.000
0.000 | 0.000
0.619 | 0.642
0.000 | 0.019
0.294 | 0.308
| Plot | Mito | Lyso | Perox | ER | Golgi | PM | Cytosol | Nucleus | |||||
| Expt A |
16 peptides |
32 spectra |
|
0.000 0.000 | 0.000 |
0.000 0.000 | 0.000 |
0.061 0.051 | 0.066 |
0.000 0.000 | 0.000 |
0.000 0.000 | 0.000 |
0.631 0.619 | 0.642 |
0.005 0.000 | 0.019 |
0.304 0.294 | 0.308 |
| 1 spectrum, IVSQEPANTPVFYLNK | 0.048 | 0.000 | 0.132 | 0.000 | 0.000 | 0.506 | 0.002 | 0.312 | ||
| 2 spectra, GAVAMNEELLR | 0.067 | 0.000 | 0.000 | 0.000 | 0.000 | 0.667 | 0.000 | 0.266 | ||
| 2 spectra, GQHELIEVDGR | 0.000 | 0.000 | 0.087 | 0.111 | 0.000 | 0.346 | 0.263 | 0.193 | ||
| 1 spectrum, VTQEVVTESSVSSR | 0.000 | 0.000 | 0.053 | 0.027 | 0.000 | 0.401 | 0.346 | 0.174 | ||
| 2 spectra, IPDFESR | 0.017 | 0.000 | 0.000 | 0.011 | 0.000 | 0.684 | 0.000 | 0.289 | ||
| 2 spectra, GNNLEKPLELR | 0.000 | 0.000 | 0.032 | 0.000 | 0.000 | 0.640 | 0.156 | 0.171 | ||
| 3 spectra, QPQSLIVTER | 0.000 | 0.000 | 0.000 | 0.067 | 0.000 | 0.488 | 0.000 | 0.445 | ||
| 1 spectrum, NVVEGIHFK | 0.080 | 0.000 | 0.000 | 0.000 | 0.000 | 0.615 | 0.077 | 0.228 | ||
| 4 spectra, AASYAGEDDFHLAK | 0.123 | 0.000 | 0.000 | 0.000 | 0.000 | 0.632 | 0.000 | 0.245 | ||
| 2 spectra, IHSDLAEER | 0.000 | 0.000 | 0.000 | 0.000 | 0.000 | 0.640 | 0.151 | 0.209 | ||
| 1 spectrum, VYAPASTLVDQHYANEENVLVTER | 0.000 | 0.000 | 0.000 | 0.000 | 0.000 | 0.709 | 0.000 | 0.291 | ||
| 4 spectra, ELDYEEMK | 0.000 | 0.000 | 0.008 | 0.000 | 0.000 | 0.673 | 0.199 | 0.120 | ||
| 1 spectrum, ATPIPITVK | 0.000 | 0.000 | 0.038 | 0.000 | 0.000 | 0.610 | 0.162 | 0.190 | ||
| 2 spectra, EGEDLSK | 0.040 | 0.000 | 0.105 | 0.000 | 0.000 | 0.475 | 0.141 | 0.239 | ||
| 3 spectra, FQVFDEDTGK | 0.102 | 0.000 | 0.000 | 0.000 | 0.000 | 0.677 | 0.000 | 0.221 | ||
| 1 spectrum, GITEPPFGIFVFDR | 0.000 | 0.000 | 0.054 | 0.000 | 0.000 | 0.636 | 0.000 | 0.310 |
| Plot | Mito | Lyso or Perox | ER | Golgi | PM | Cytosol | Nucleus | ||||||
| Expt B |
9 peptides |
11 spectra |
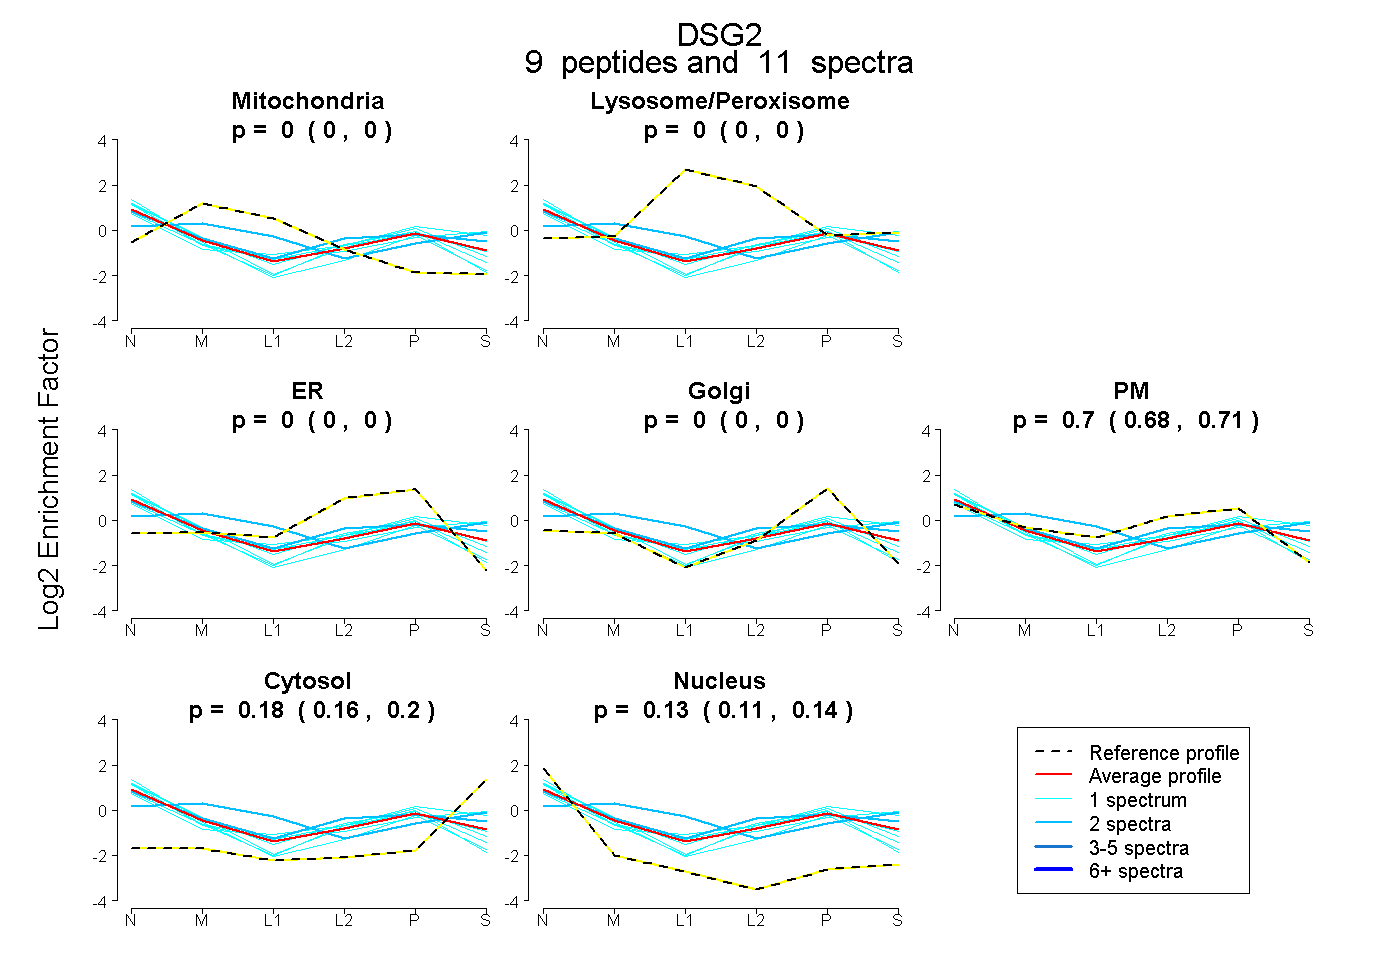 |
0.000 0.000 | 0.000 |
0.000 0.000 | 0.000 |
0.000 0.000 | 0.000 |
0.000 0.000 | 0.000 |
0.696 0.679 | 0.709 |
0.179 0.155 | 0.198 |
0.126 0.109 | 0.141 |
|||
| Plot | Lyso | Other | |||||||||||
| Expt C |
19 peptides |
62 spectra |
 |
0.000 0.000 | 0.000 |
1.000 1.000 | 1.000 |
||||||||
| Plot | Lyso | Other | |||||||||||
| Expt D |
3 peptides |
7 spectra |
 |
0.000 0.000 | 0.000 |
1.000 1.000 | 1.000 |