 6
6peptides
spectra
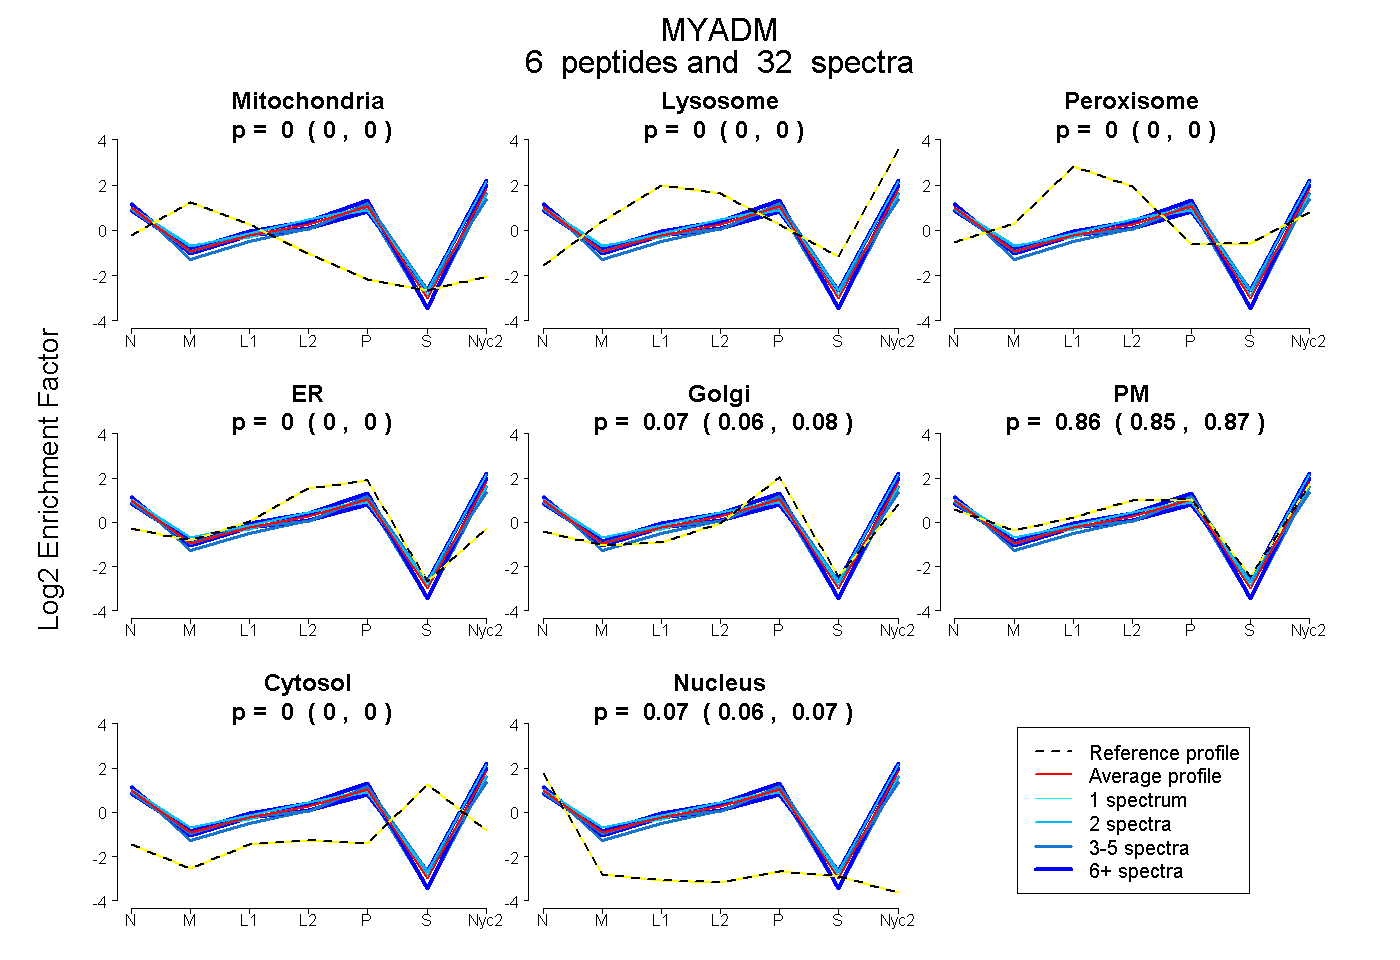
0.000 | 0.000
0.000 | 0.000
0.000 | 0.000
0.000 | 0.000
0.061 | 0.083
0.847 | 0.870
0.000 | 0.000
0.064 | 0.072
3peptides
spectra
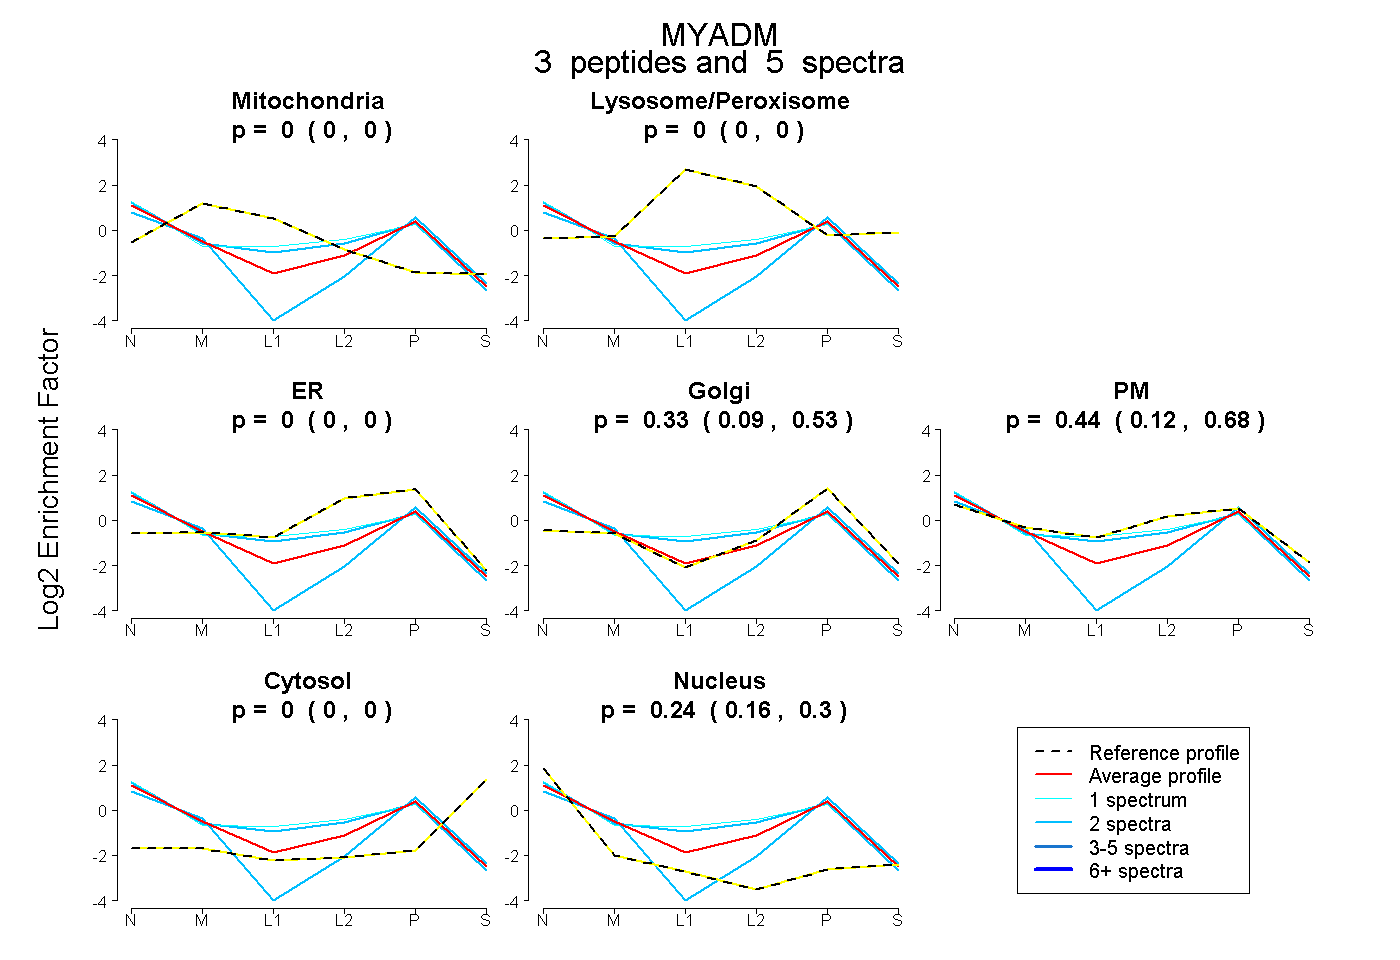
0.000 | 0.000
0.000 | 0.000
0.000 | 0.000
0.087 | 0.535
0.116 | 0.682
0.000 | 0.000
0.162 | 0.302
7peptides
spectra
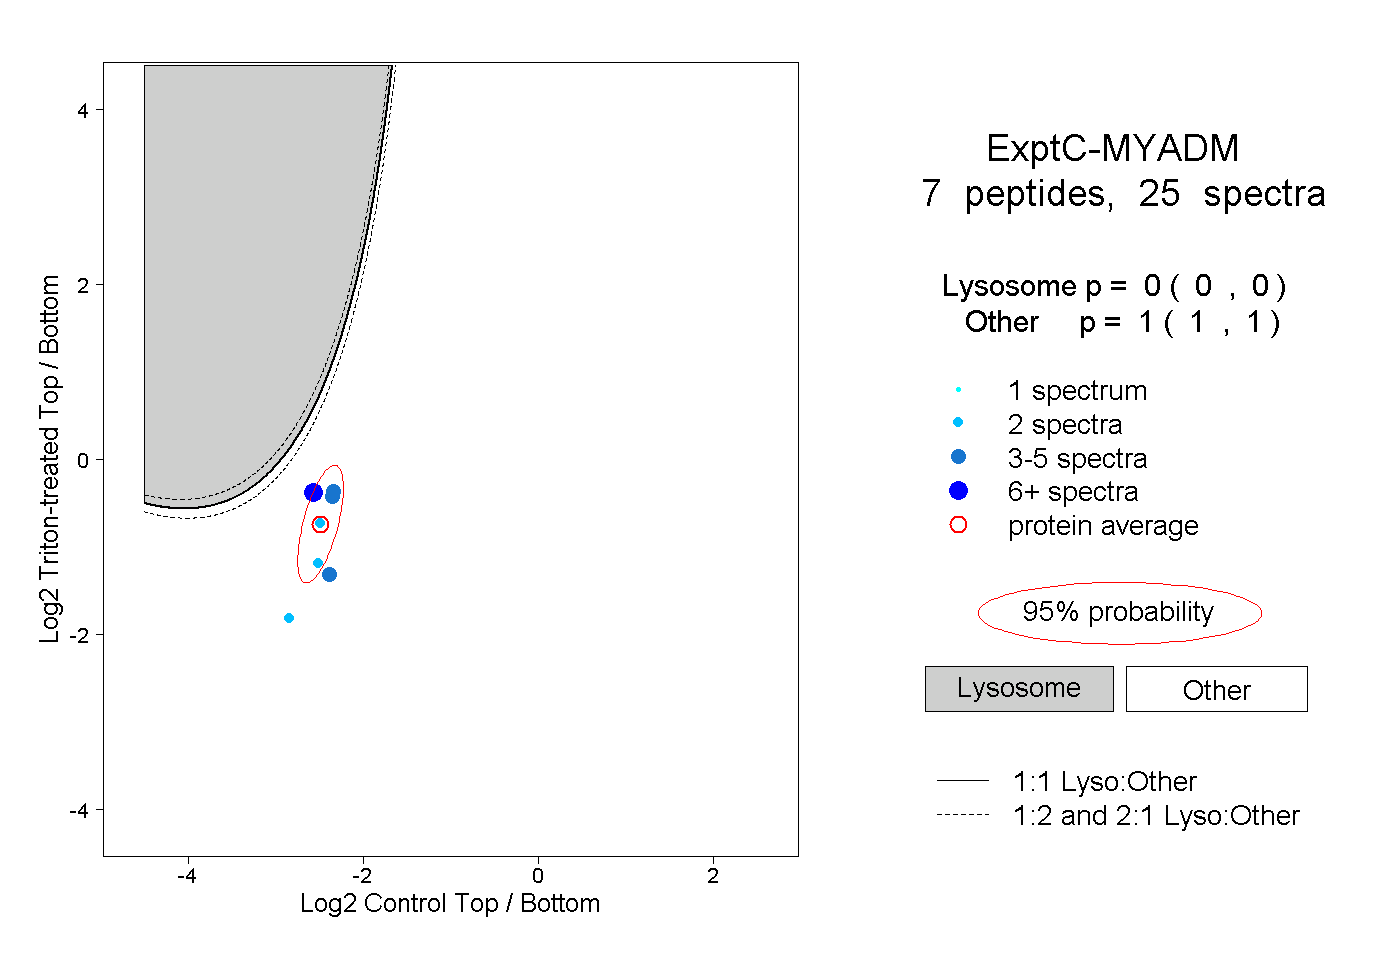
0.000 | 0.000
1.000 | 1.000
2peptides
spectra
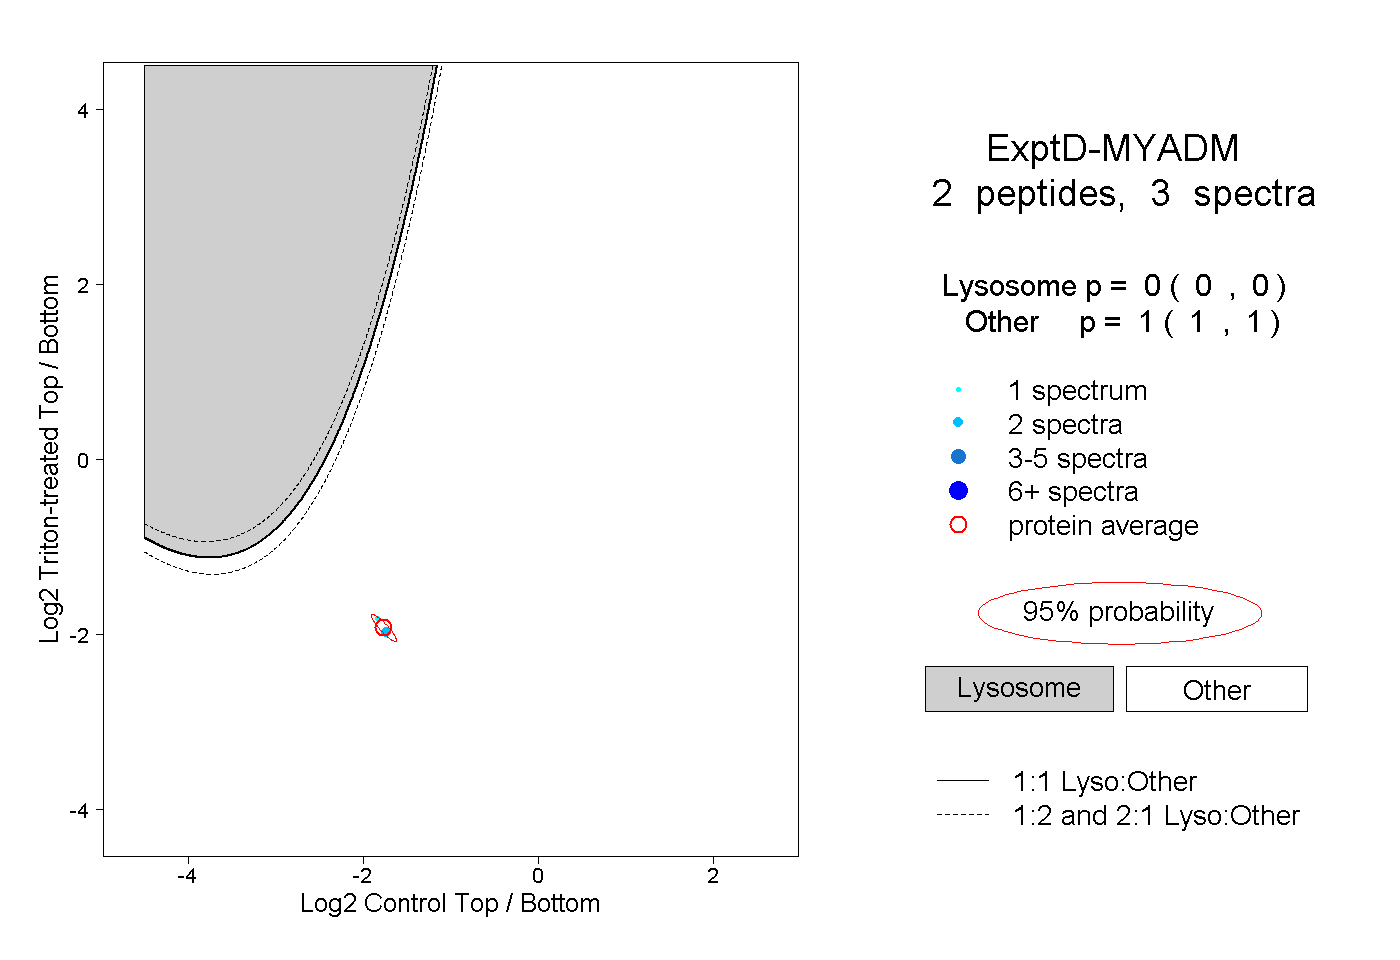
0.000 | 0.000
1.000 | 1.000