MYADM
[ENSRNOP00000022264]
Main page
| | | Plot |
Mito |
Lyso |
|
Perox |
ER |
Golgi |
PM |
Cytosol |
Nucleus |
|
| Expt A |
 6
6
peptides |
32
spectra |
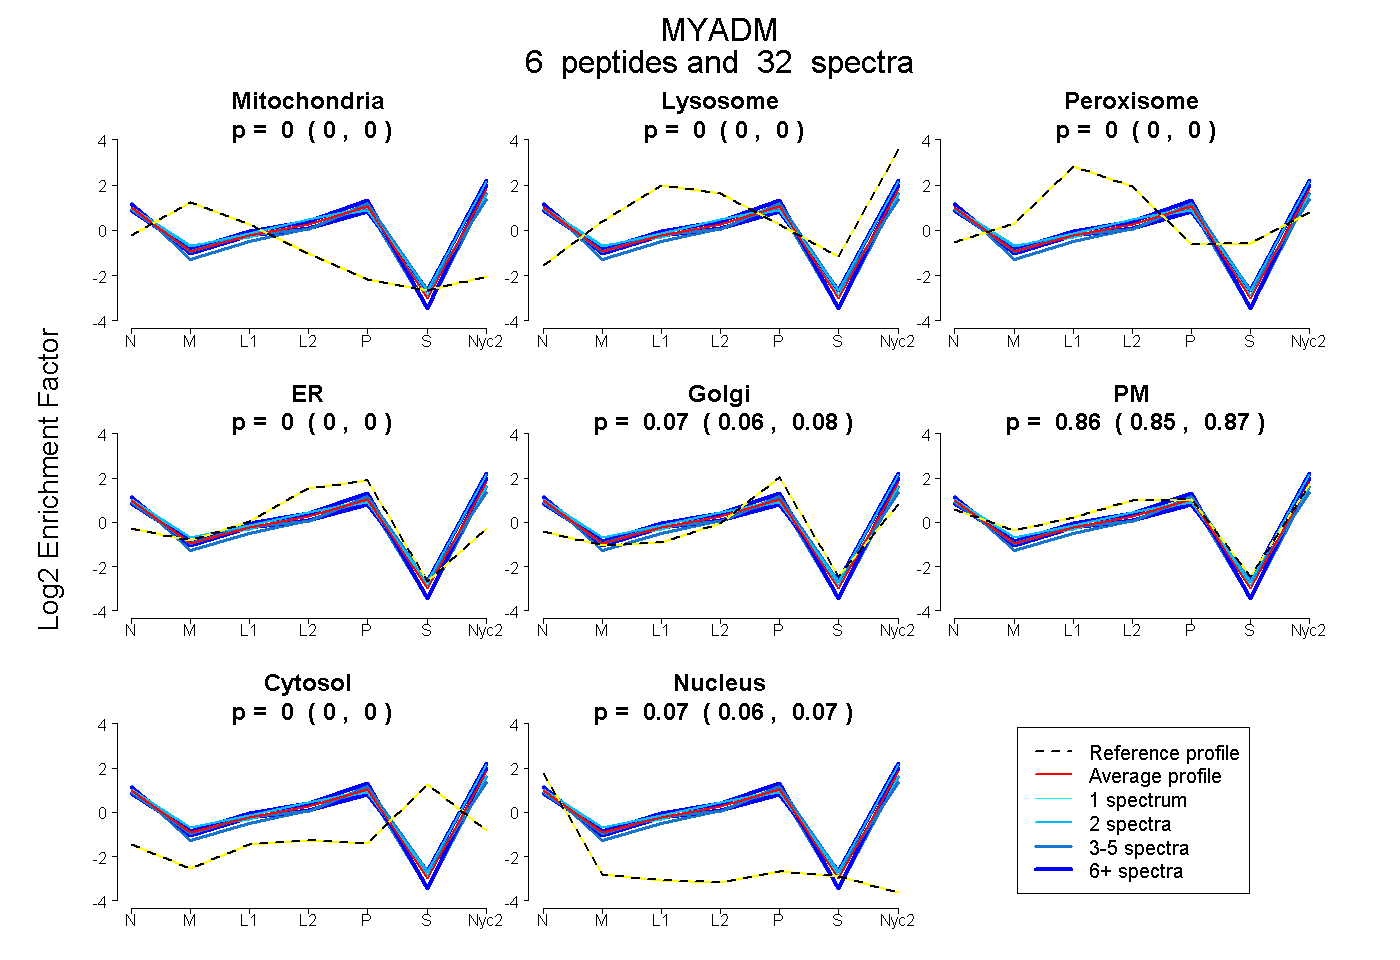 |
0.000
0.000 | 0.000 |
0.000
0.000 | 0.000 |
|
0.000
0.000 | 0.000 |
0.000
0.000 | 0.000 |
0.073
0.061 | 0.083 |
0.859
0.847 | 0.870 |
0.000
0.000 | 0.000 |
0.068
0.064 | 0.072 |
|
| | | Plot |
Mito |
|
Lyso or Perox |
|
ER |
Golgi |
PM |
Cytosol |
Nucleus |
|
| Expt B |
3
peptides |
5
spectra |
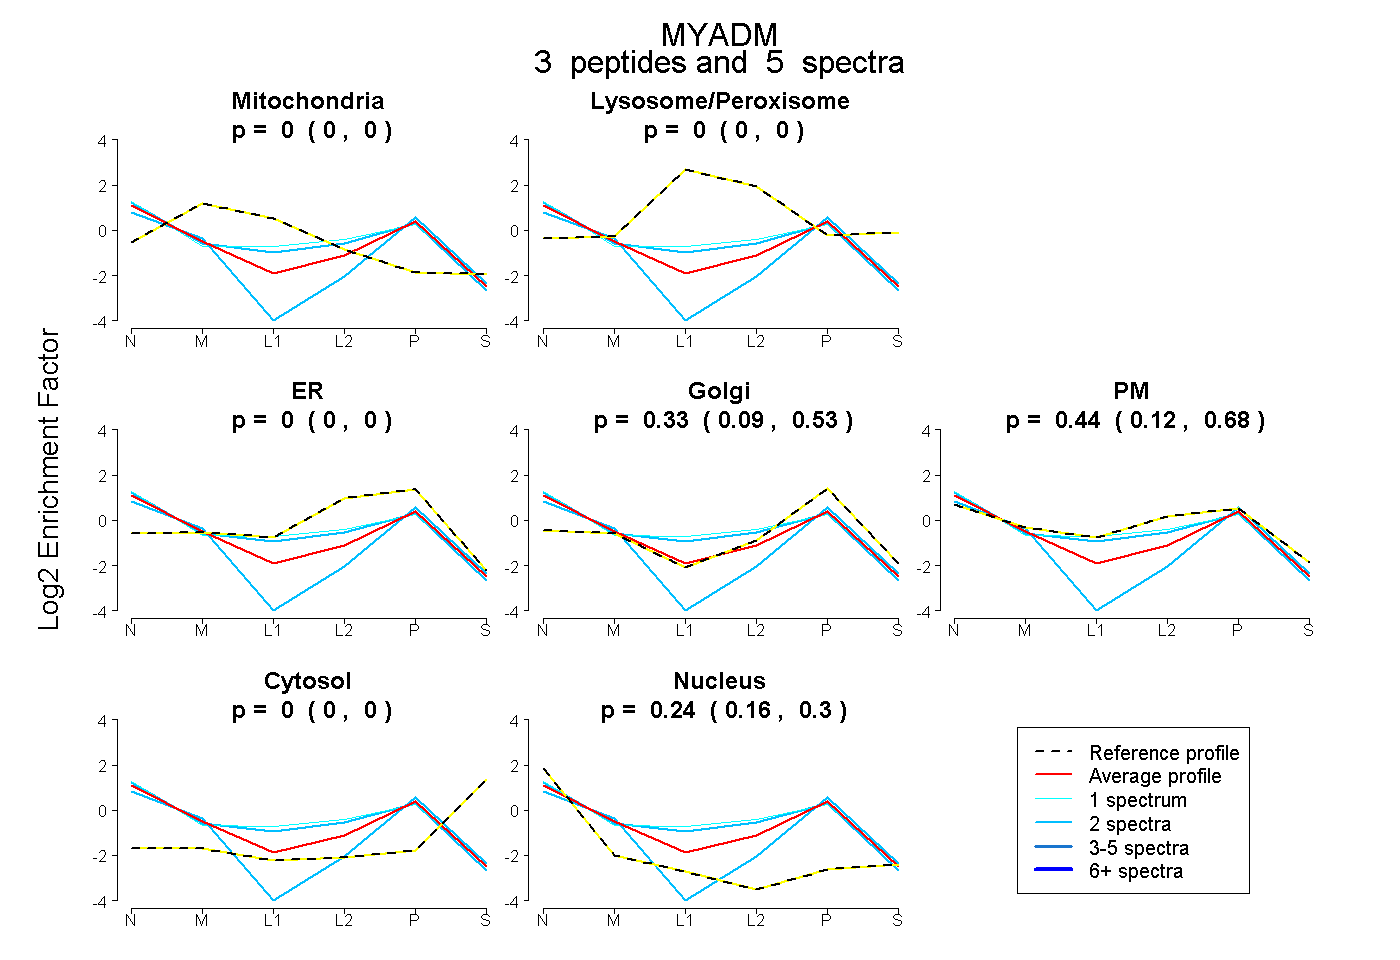 |
0.000
0.000 | 0.000 |
|
0.000
0.000 | 0.000 |
|
0.000
0.000 | 0.000 |
0.326
0.087 | 0.535 |
0.437
0.116 | 0.682 |
0.000
0.000 | 0.000 |
0.237
0.162 | 0.302 |
|
| | | Plot |
|
Lyso |
|
|
|
|
|
|
|
Other |
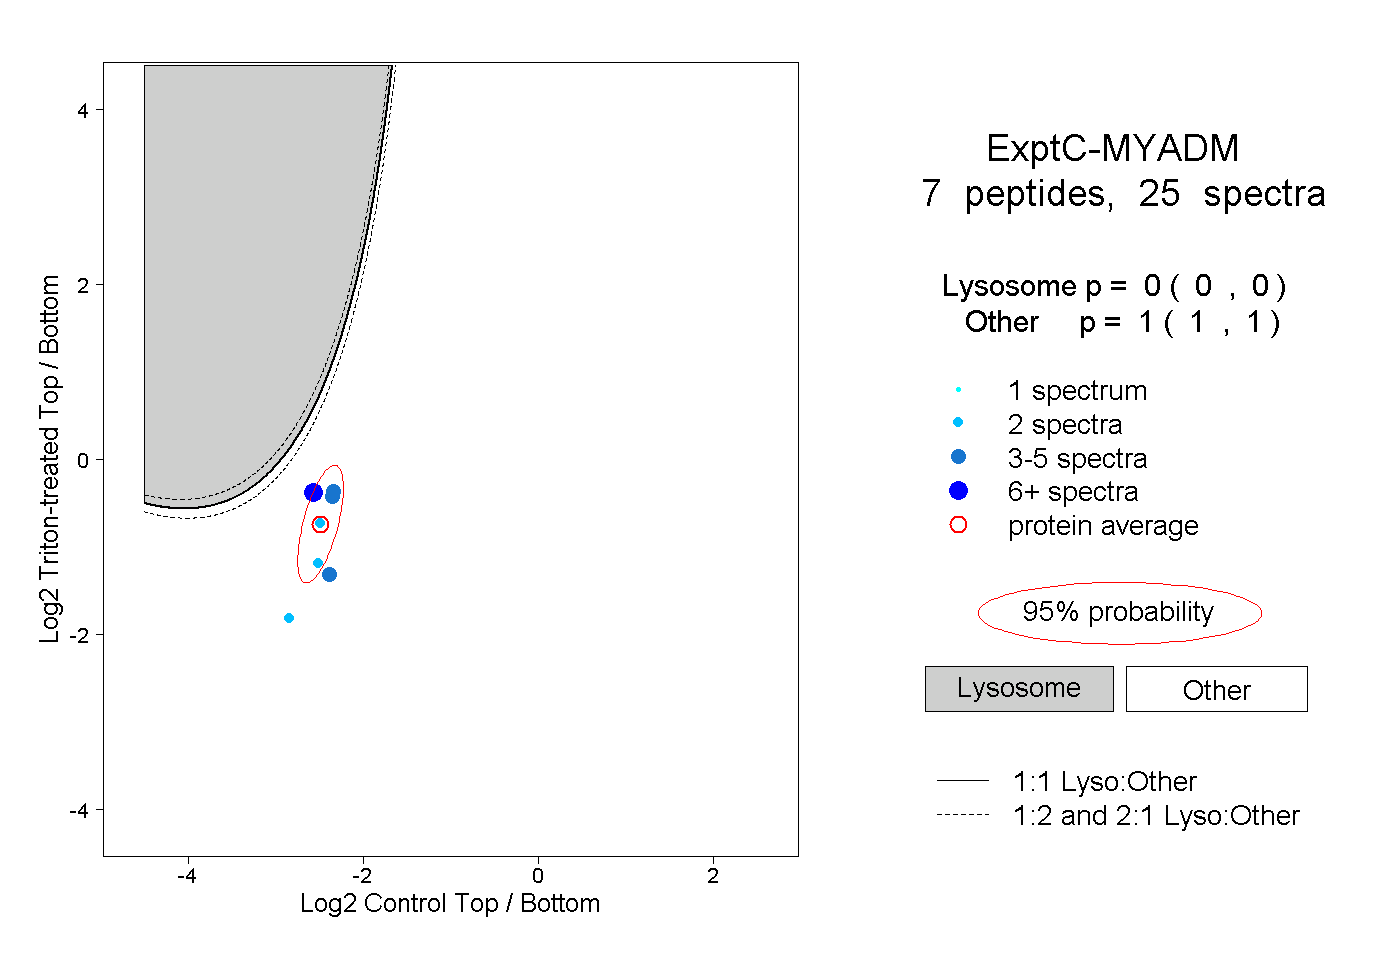
| Expt C |
7
peptides |
25
spectra |
 |
|
0.000
0.000 | 0.000 |
|
|
|
|
|
|
|
1.000
1.000 | 1.000 |
| 2 spectra, SYVQPNEVCNWDR |
|
0.000 |
|
|
|
|
|
|
|
1.000 |
| 3 spectra, SMDPSCSR |
|
0.000 |
|
|
|
|
|
|
|
1.000 |
| 4 spectra, PVTVTR |
|
0.000 |
|
|
|
|
|
|
|
1.000 |
| 8 spectra, FPLSWR |
|
0.000 |
|
|
|
|
|
|
|
1.000 |
| 2 spectra, YNSQPR |
|
0.000 |
|
|
|
|
|
|
|
1.000 |
| 2 spectra, LVFVK |
|
0.000 |
|
|
|
|
|
|
|
1.000 |
| 4 spectra, ALTQPLGLLR |
|
0.000 |
|
|
|
|
|
|
|
1.000 |
| | | Plot |
|
Lyso |
|
|
|
|
|
|
|
Other |
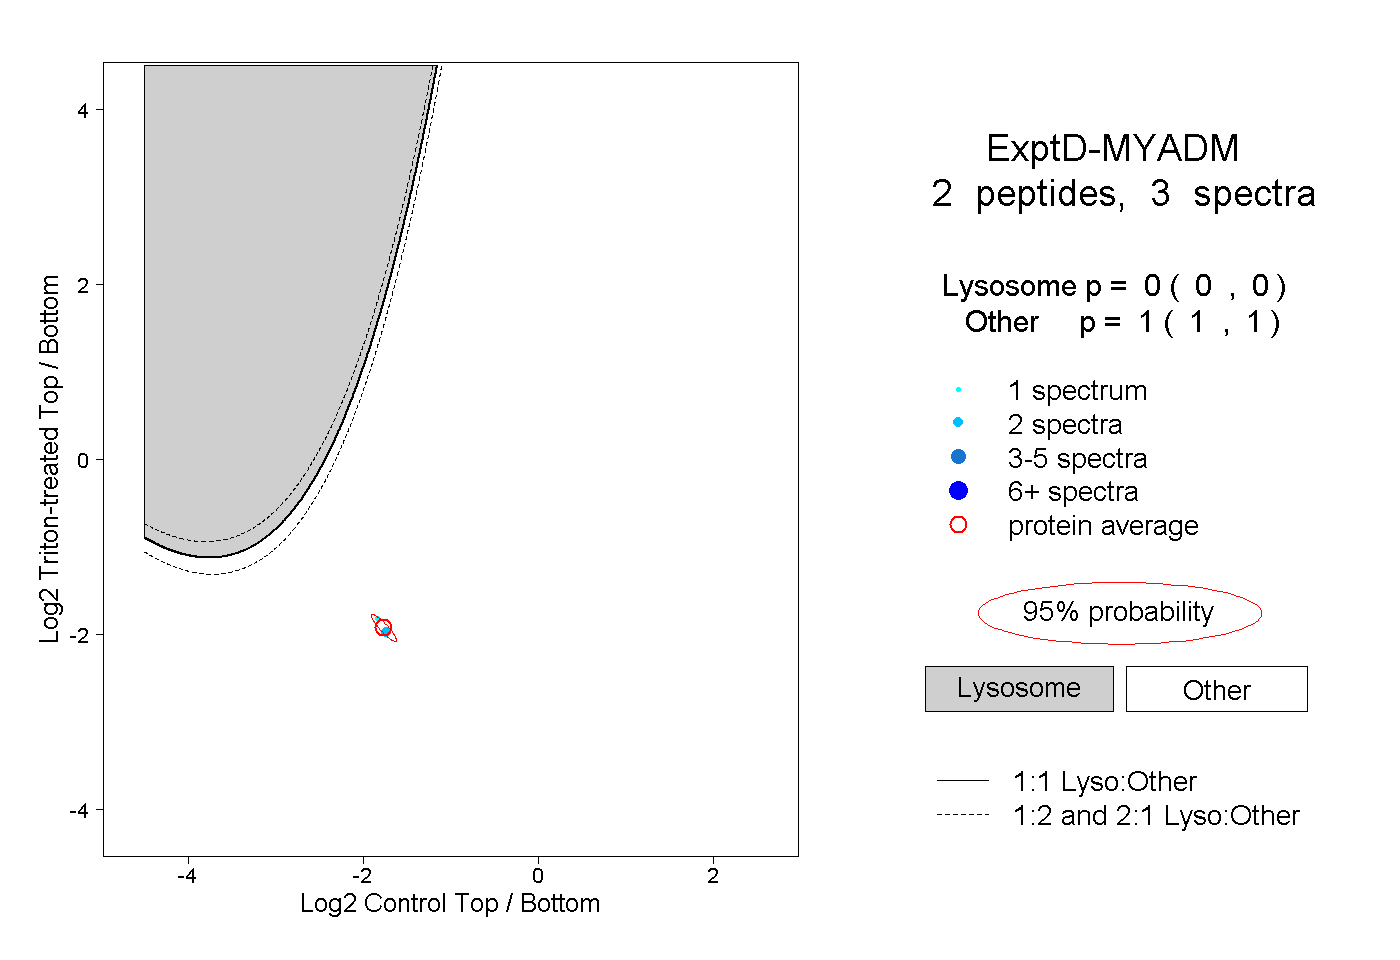
| Expt D |
2
peptides |
3
spectra |
 |
|
0.000
0.000 | 0.000 |
|
|
|
|
|
|
|
1.000
1.000 | 1.000 |