 8
8peptides
spectra
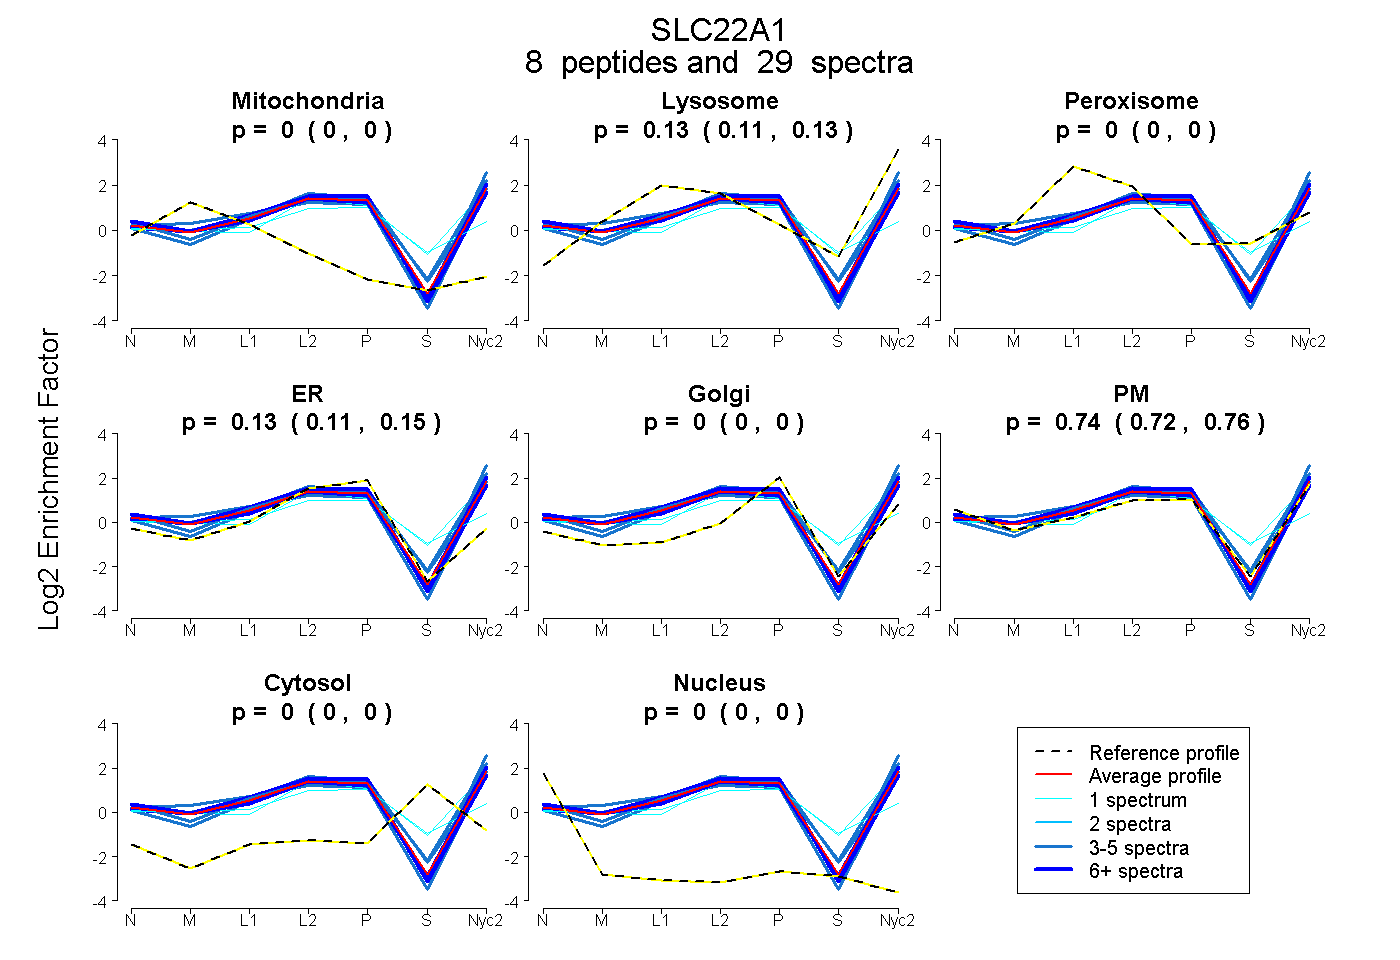
0.000 | 0.000
0.114 | 0.134
0.000 | 0.000
0.110 | 0.147
0.000 | 0.000
0.725 | 0.761
0.000 | 0.000
0.000 | 0.000
3peptides
spectra
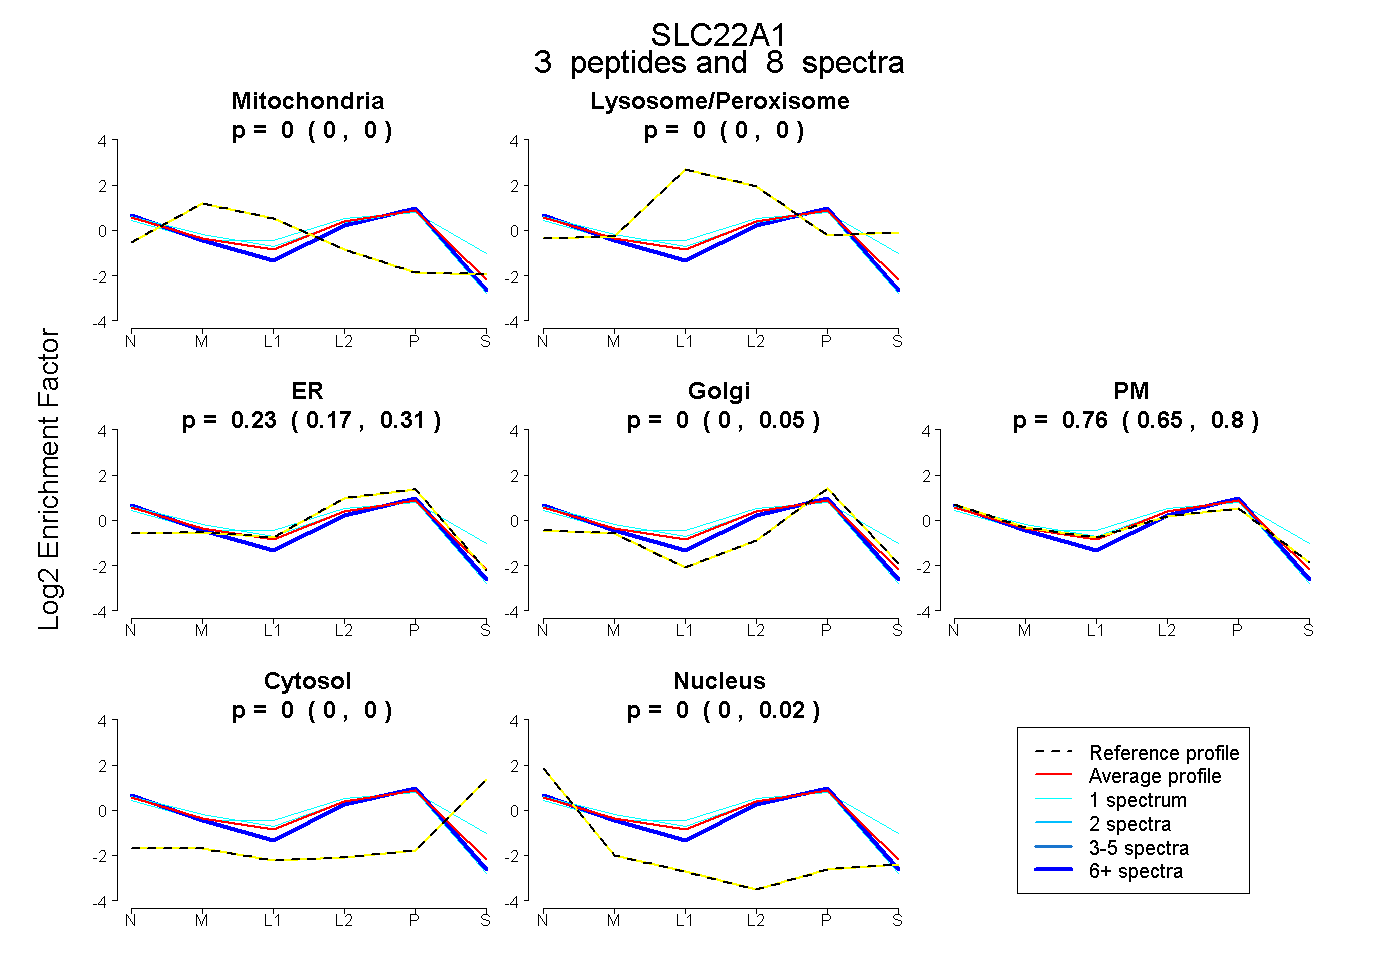
0.000 | 0.000
0.000 | 0.000
0.169 | 0.307
0.000 | 0.052
0.647 | 0.797
0.000 | 0.000
0.000 | 0.020
8peptides
spectra
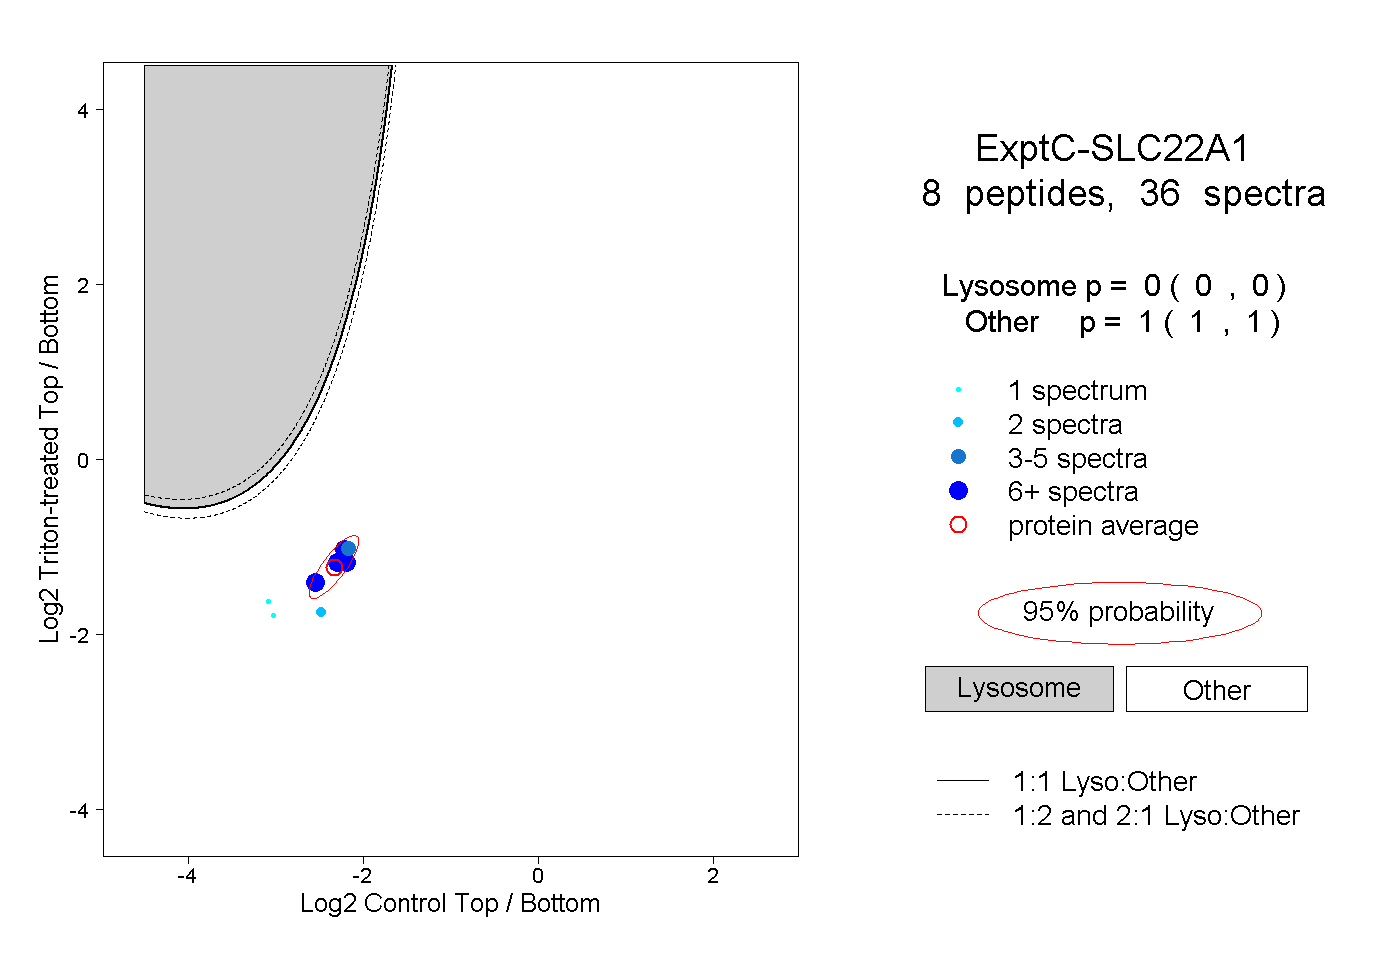
0.000 | 0.000
1.000 | 1.000
4peptides
spectra
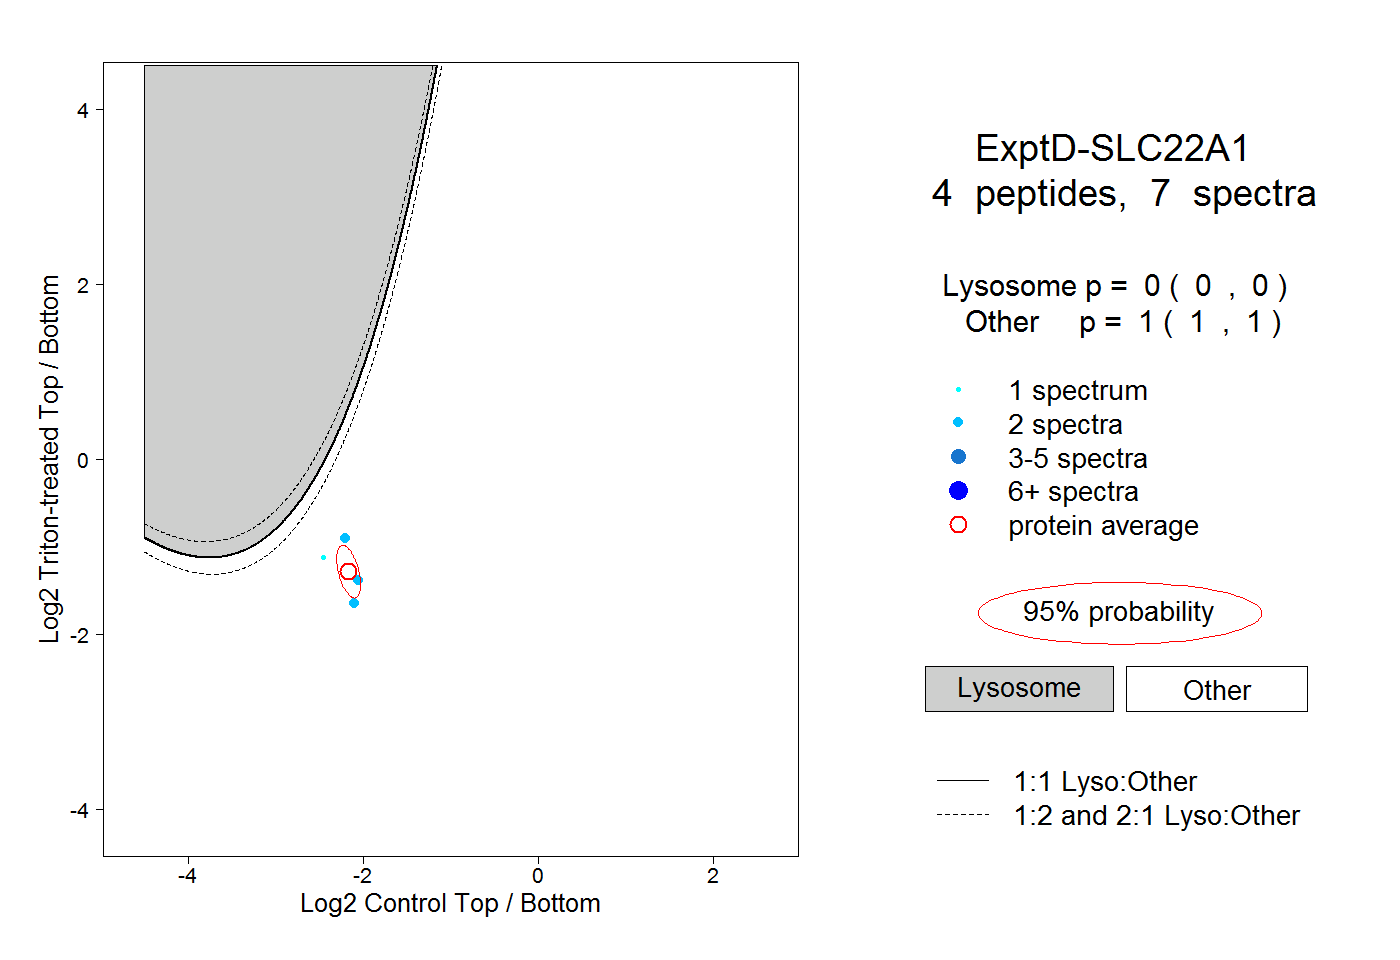
0.000 | 0.000
1.000 | 1.000