 8
8peptides
spectra
0.000 | 0.000
0.114 | 0.134
0.000 | 0.000
0.110 | 0.147
0.000 | 0.000
0.725 | 0.761
0.000 | 0.000
0.000 | 0.000
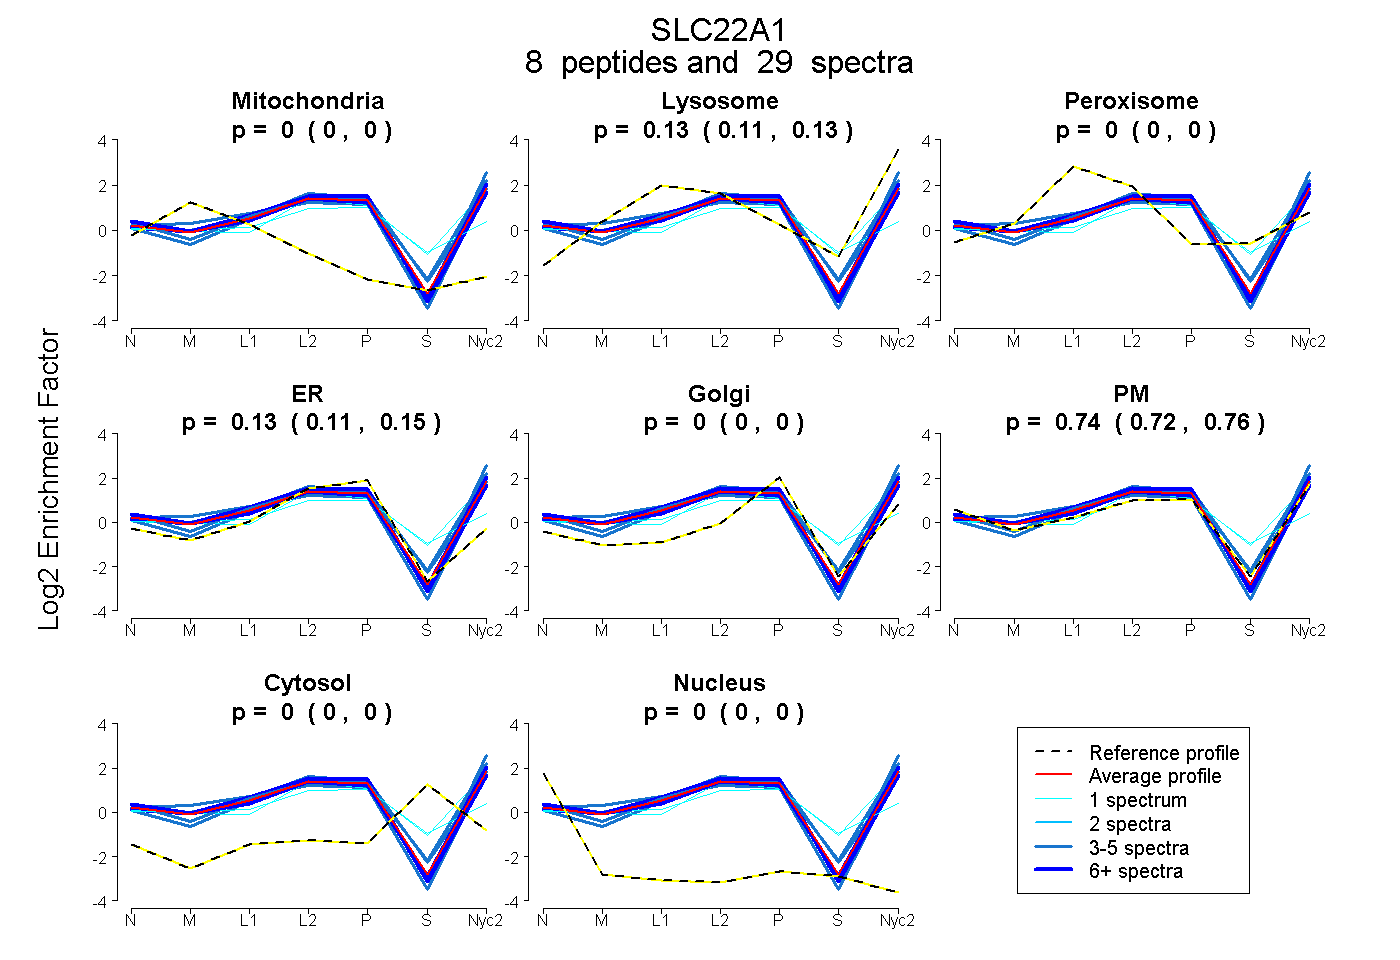
| Plot | Mito | Lyso | Perox | ER | Golgi | PM | Cytosol | Nucleus | |||||
| Expt A |
8 peptides |
29 spectra |
|
0.000 0.000 | 0.000 |
0.125 0.114 | 0.134 |
0.000 0.000 | 0.000 |
0.130 0.110 | 0.147 |
0.000 0.000 | 0.000 |
0.745 0.725 | 0.761 |
0.000 0.000 | 0.000 |
0.000 0.000 | 0.000 |
| 4 spectra, LLQGMVSK | 0.000 | 0.185 | 0.000 | 0.000 | 0.000 | 0.815 | 0.000 | 0.000 | ||
| 3 spectra, SPSFADLFR | 0.000 | 0.174 | 0.000 | 0.001 | 0.000 | 0.825 | 0.000 | 0.000 | ||
| 1 spectrum, VPPADLK | 0.009 | 0.000 | 0.248 | 0.227 | 0.152 | 0.242 | 0.121 | 0.000 | ||
| 6 spectra, MLCLEEDASEK | 0.000 | 0.127 | 0.000 | 0.240 | 0.000 | 0.633 | 0.000 | 0.000 | ||
| 6 spectra, WLLSQK | 0.000 | 0.087 | 0.000 | 0.019 | 0.000 | 0.894 | 0.000 | 0.000 | ||
| 5 spectra, GVALPETIEEAENLGR | 0.013 | 0.099 | 0.000 | 0.056 | 0.000 | 0.832 | 0.000 | 0.000 | ||
| 1 spectrum, PTVDDVLEQVGEFGWFQK | 0.000 | 0.231 | 0.000 | 0.055 | 0.000 | 0.612 | 0.103 | 0.000 | ||
| 3 spectra, IMEQIAQK | 0.000 | 0.157 | 0.000 | 0.274 | 0.009 | 0.560 | 0.000 | 0.000 |
| Plot | Mito | Lyso or Perox | ER | Golgi | PM | Cytosol | Nucleus | ||||||
| Expt B |
3 peptides |
8 spectra |
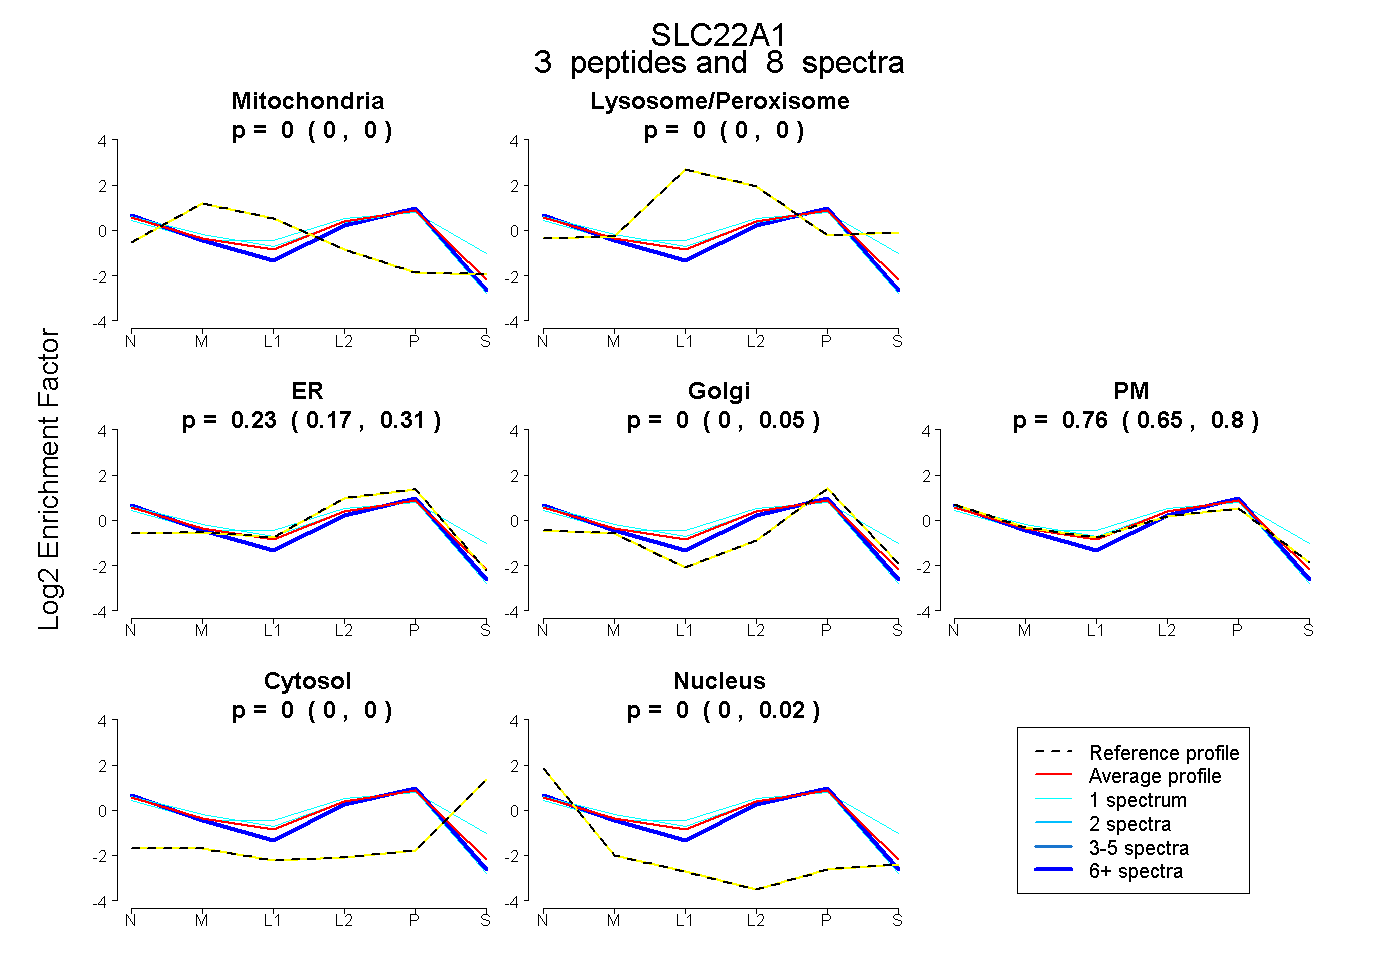 |
0.000 0.000 | 0.000 |
0.000 0.000 | 0.000 |
0.232 0.169 | 0.307 |
0.003 0.000 | 0.052 |
0.765 0.647 | 0.797 |
0.000 0.000 | 0.000 |
0.000 0.000 | 0.020 |
|||
| Plot | Lyso | Other | |||||||||||
| Expt C |
8 peptides |
36 spectra |
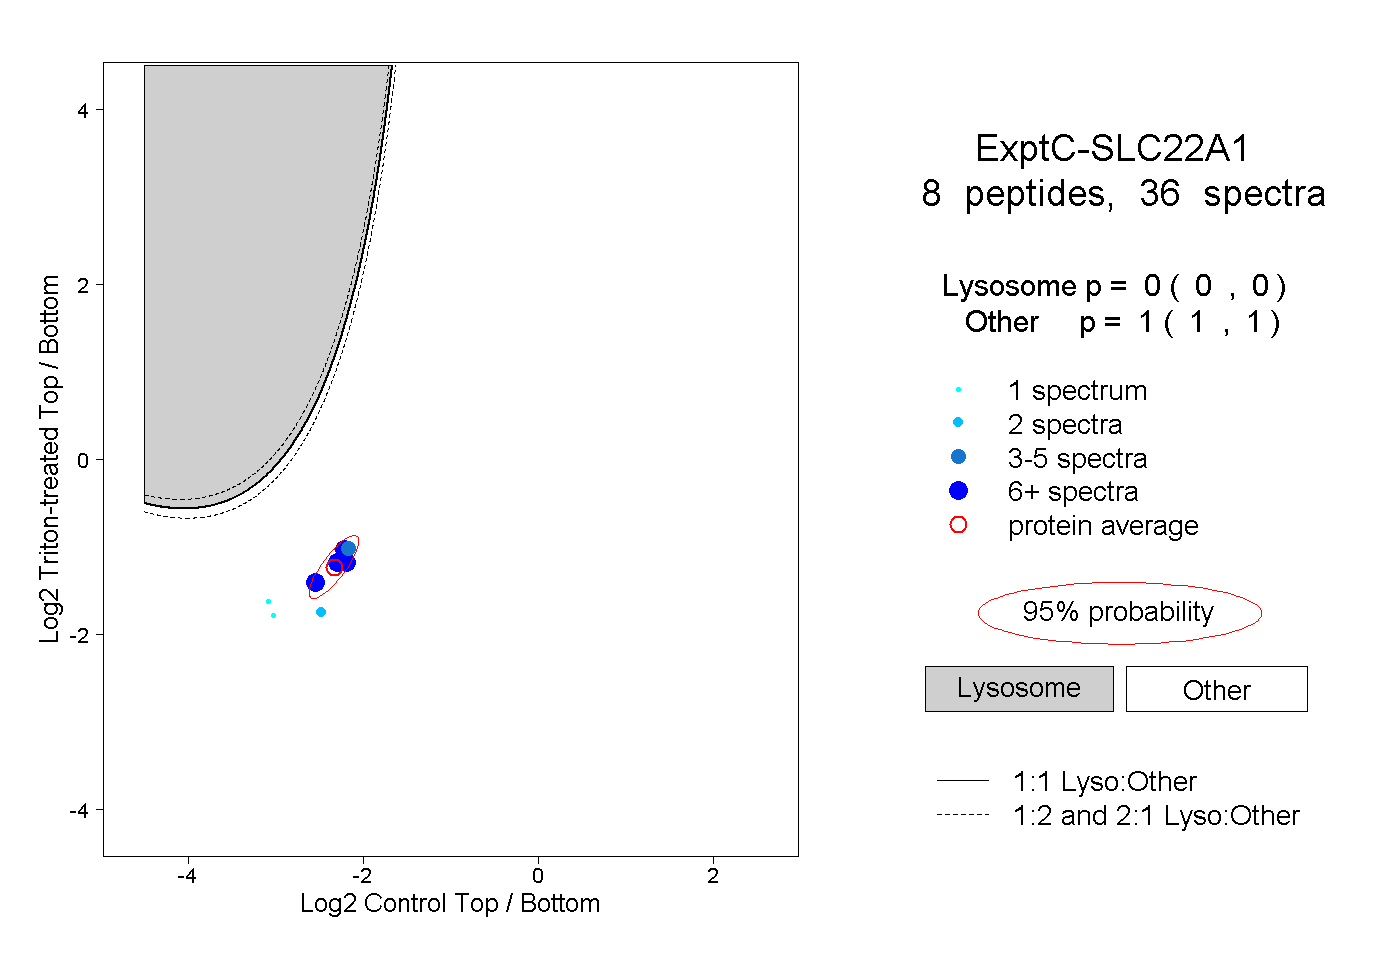 |
0.000 0.000 | 0.000 |
1.000 1.000 | 1.000 |
||||||||
| Plot | Lyso | Other | |||||||||||
| Expt D |
4 peptides |
7 spectra |
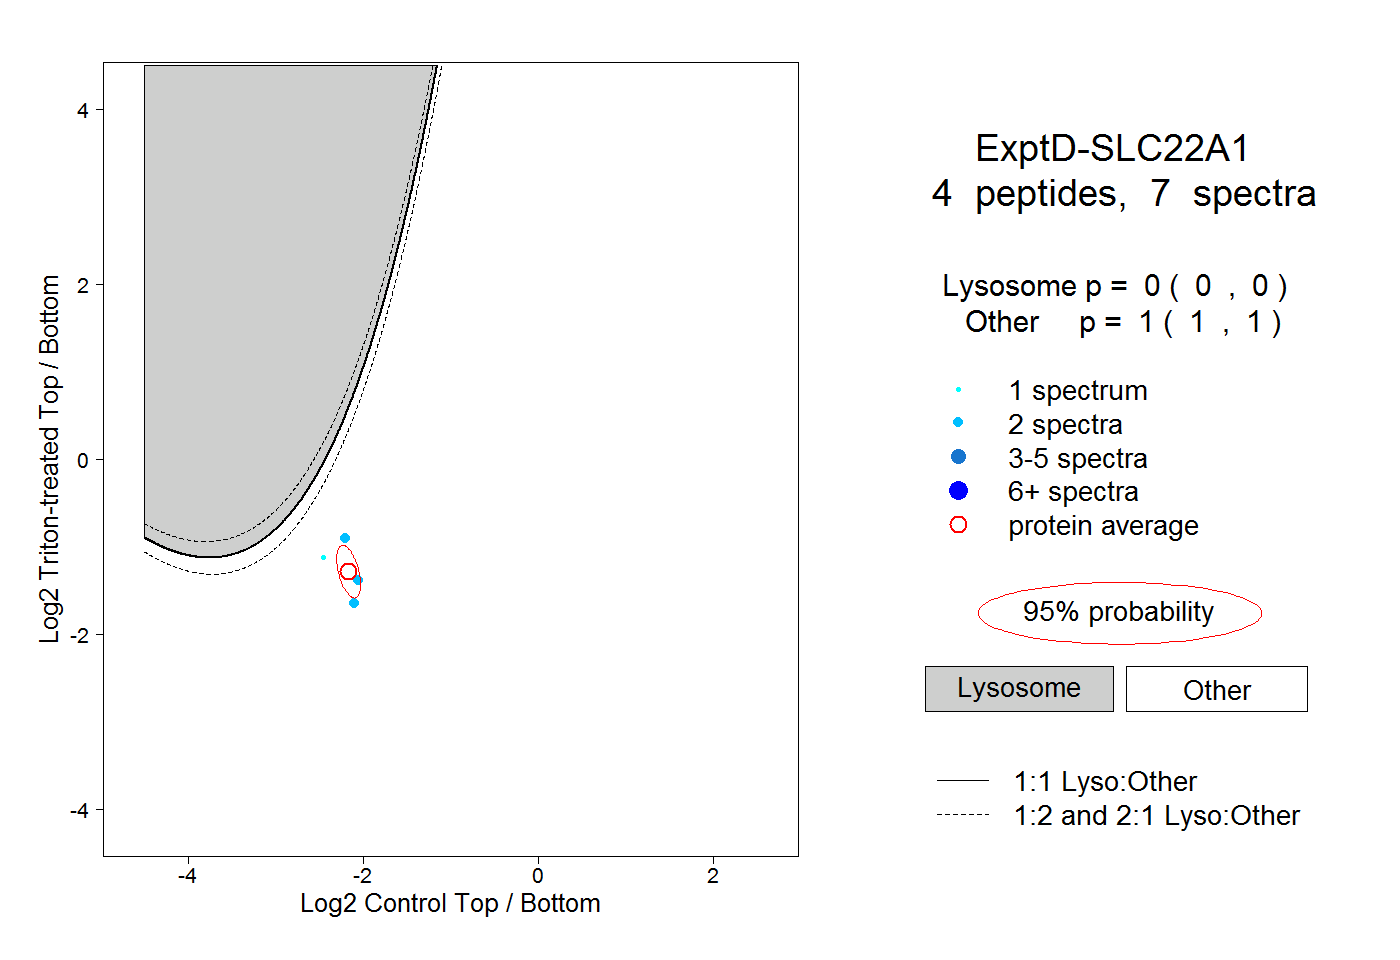 |
0.000 0.000 | 0.000 |
1.000 1.000 | 1.000 |