 5
5peptides
spectra
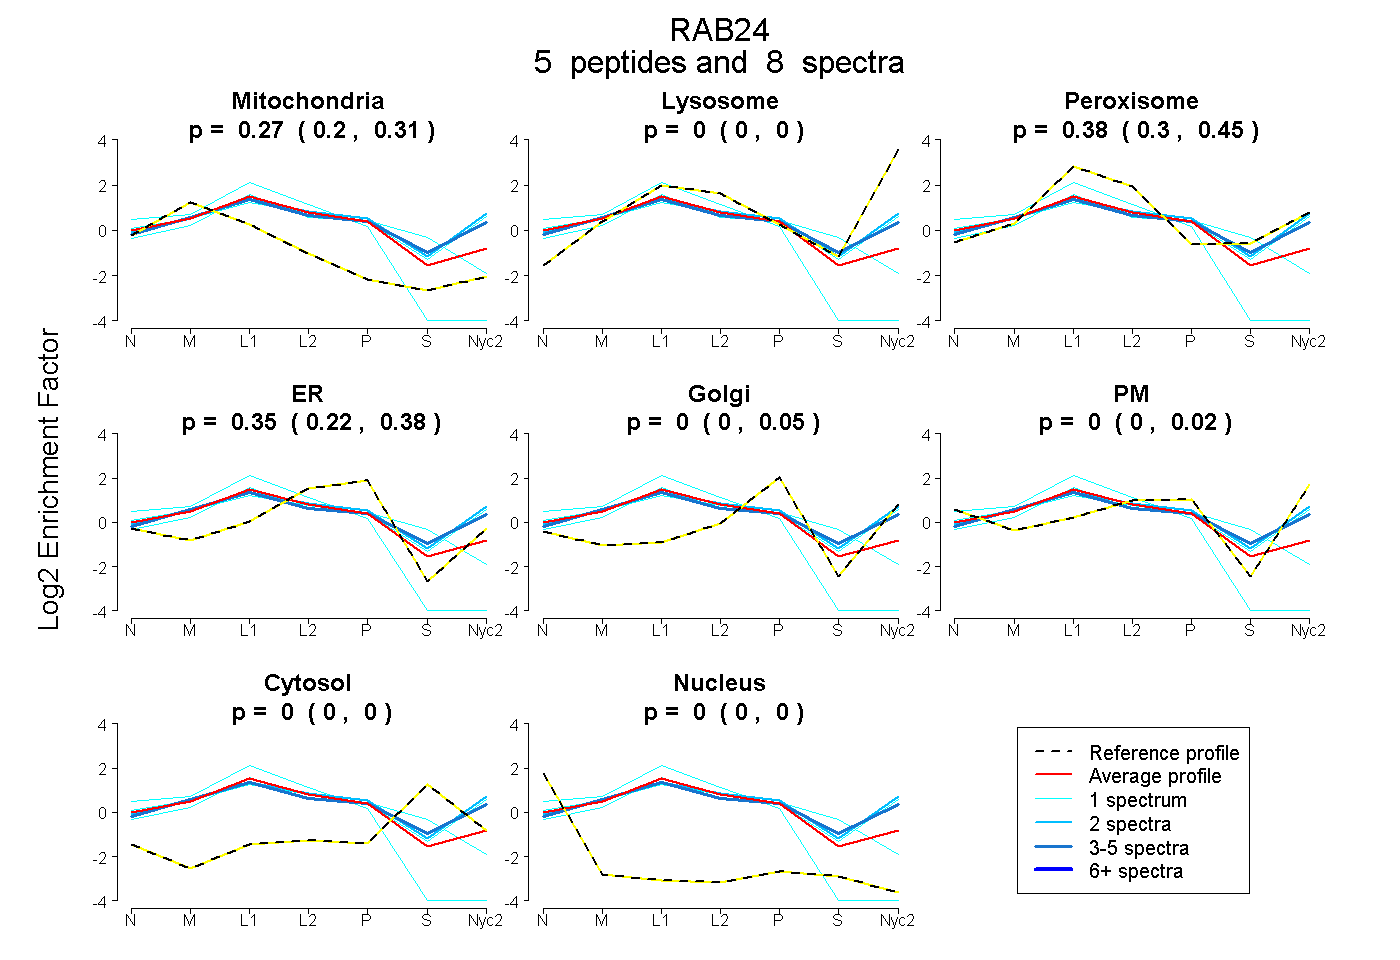
0.202 | 0.315
0.000 | 0.000
0.300 | 0.450
0.219 | 0.379
0.000 | 0.051
0.000 | 0.025
0.000 | 0.004
0.000 | 0.000
1peptide
spectra

0.169 | 0.266
0.350 | 0.480
0.053 | 0.301
0.020 | 0.222
0.000 | 0.169
0.000 | 0.000
0.000 | 0.000
4peptides
spectra
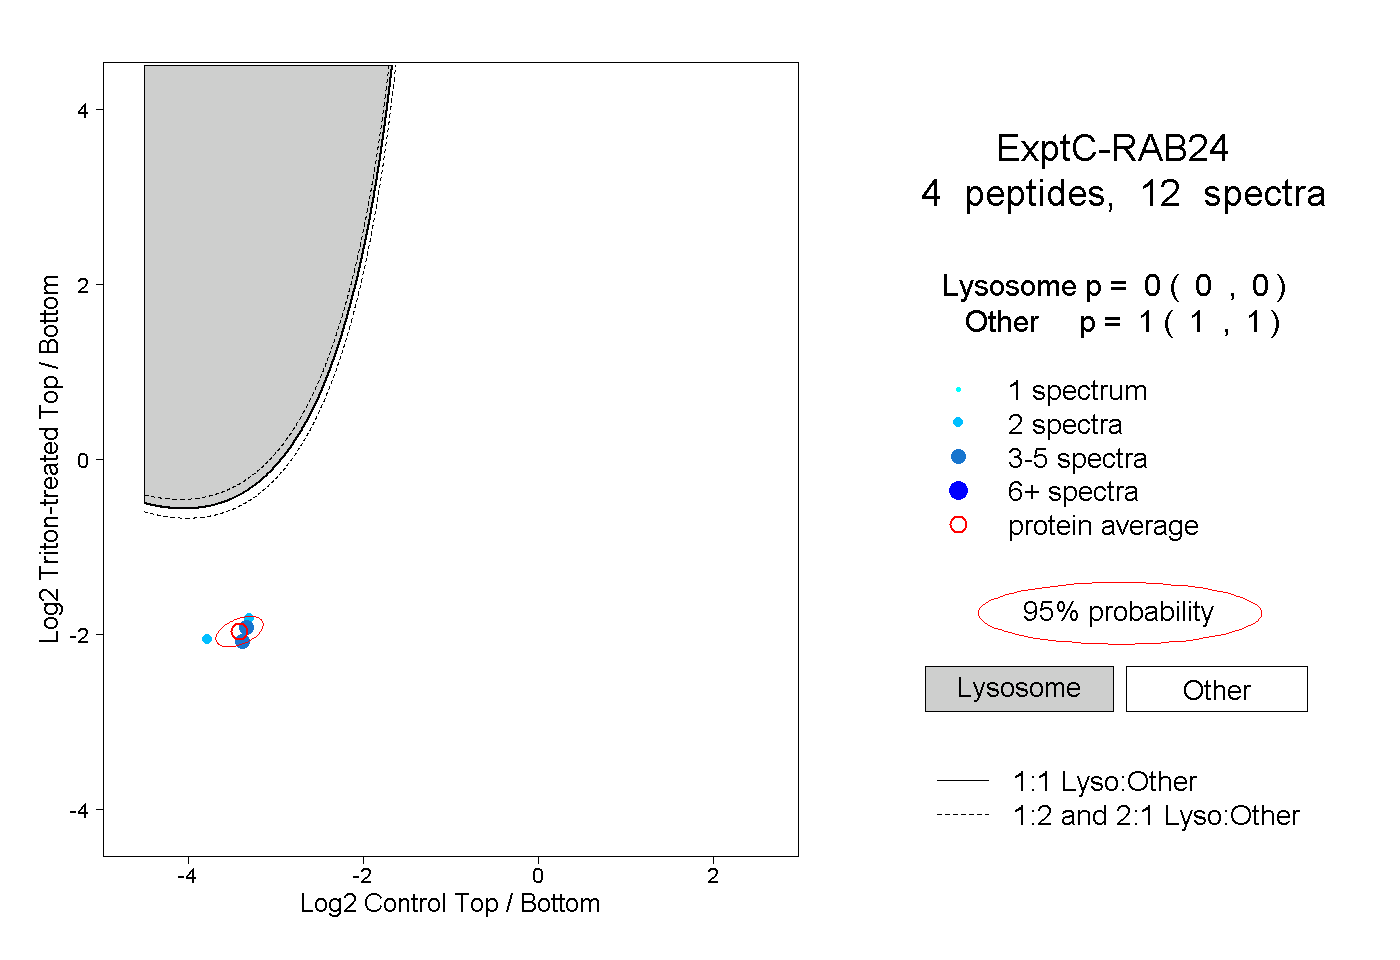
0.000 | 0.000
1.000 | 1.000
1peptide
spectra
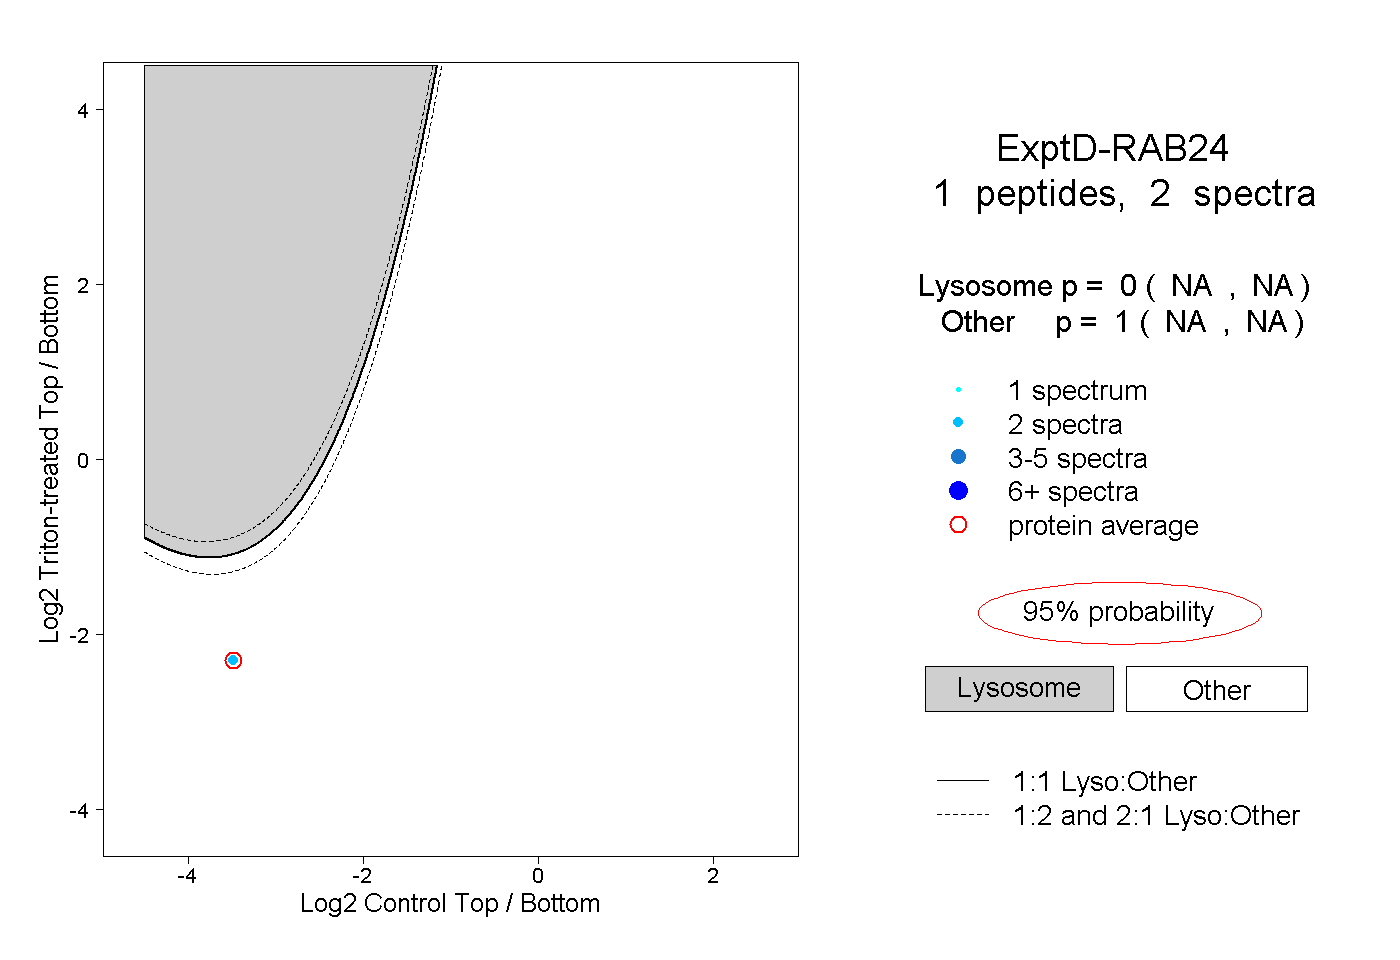
NA | NA
NA | NA