 5
5peptides
spectra
0.202 | 0.315
0.000 | 0.000
0.300 | 0.450
0.219 | 0.379
0.000 | 0.051
0.000 | 0.025
0.000 | 0.004
0.000 | 0.000
| Plot | Mito | Lyso | Perox | ER | Golgi | PM | Cytosol | Nucleus | |||||
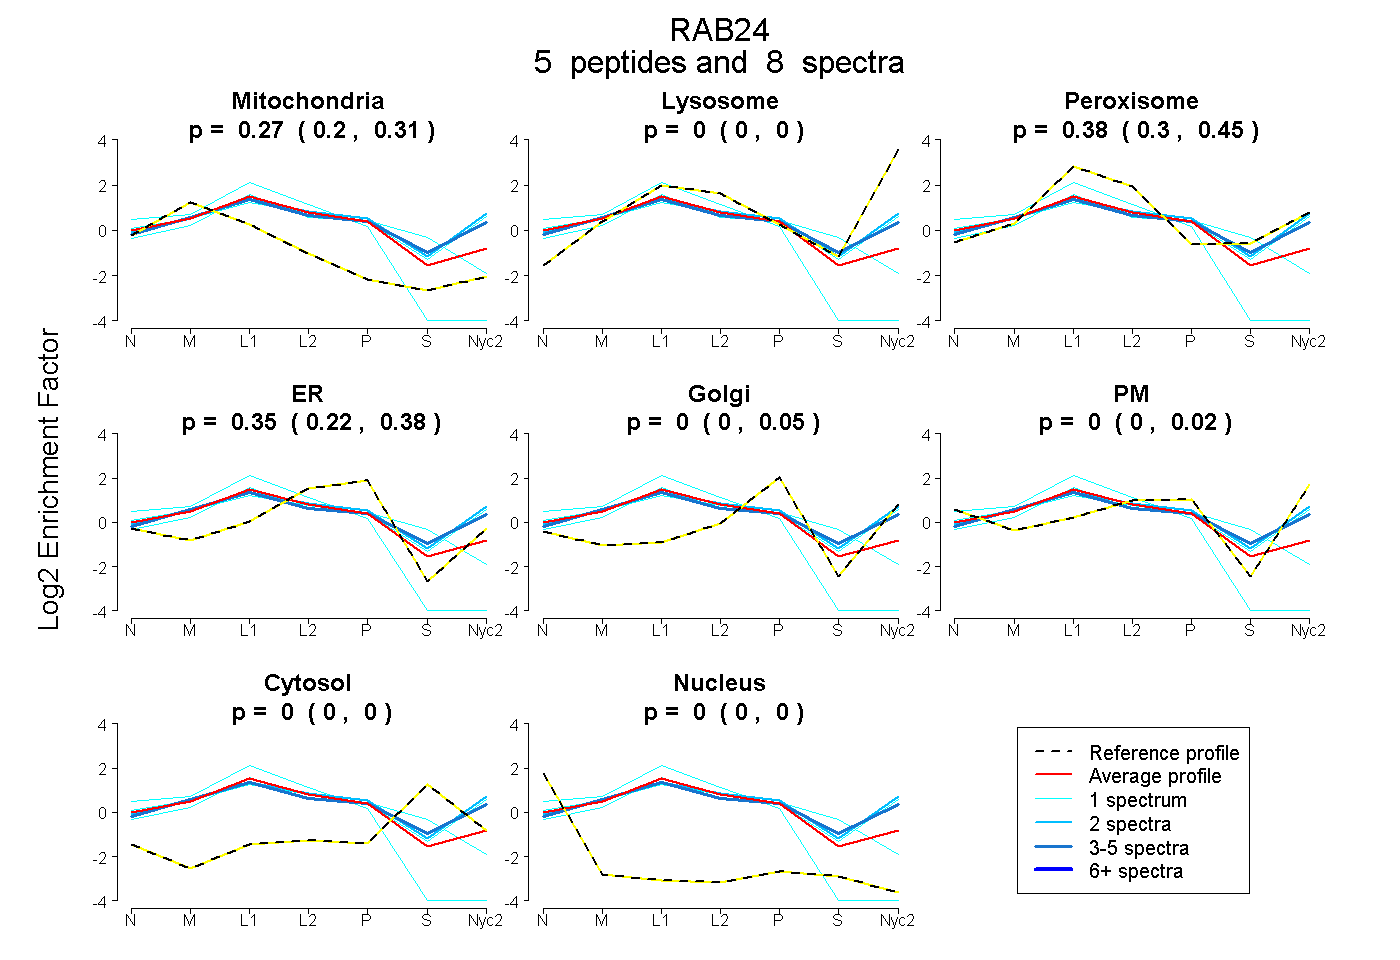
| Expt A |
5 peptides |
8 spectra |
|
0.268 0.202 | 0.315 |
0.000 0.000 | 0.000 |
0.380 0.300 | 0.450 |
0.352 0.219 | 0.379 |
0.000 0.000 | 0.051 |
0.000 0.000 | 0.025 |
0.000 0.000 | 0.004 |
0.000 0.000 | 0.000 |
| 2 spectra, SDLLEEDR | 0.081 | 0.007 | 0.514 | 0.000 | 0.229 | 0.169 | 0.000 | 0.000 | ||
| 1 spectrum, FLVGPYQNTIGAAFVAK | 0.596 | 0.000 | 0.000 | 0.404 | 0.000 | 0.000 | 0.000 | 0.000 | ||
| 1 spectrum, AAIVCYDLTDSSSFER | 0.235 | 0.000 | 0.390 | 0.231 | 0.000 | 0.000 | 0.144 | 0.000 | ||
| 3 spectra, VMCVGDR | 0.137 | 0.000 | 0.558 | 0.000 | 0.305 | 0.000 | 0.000 | 0.000 | ||
| 1 spectrum, TVTLGIWDTAGSER | 0.130 | 0.000 | 0.448 | 0.000 | 0.161 | 0.260 | 0.000 | 0.000 |
| Plot | Mito | Lyso or Perox | ER | Golgi | PM | Cytosol | Nucleus | ||||||
| Expt B |
1 peptide |
3 spectra |
 |
0.230 0.169 | 0.266 |
0.424 0.350 | 0.480 |
0.203 0.053 | 0.301 |
0.144 0.020 | 0.222 |
0.000 0.000 | 0.169 |
0.000 0.000 | 0.000 |
0.000 0.000 | 0.000 |
|||
| Plot | Lyso | Other | |||||||||||
| Expt C |
4 peptides |
12 spectra |
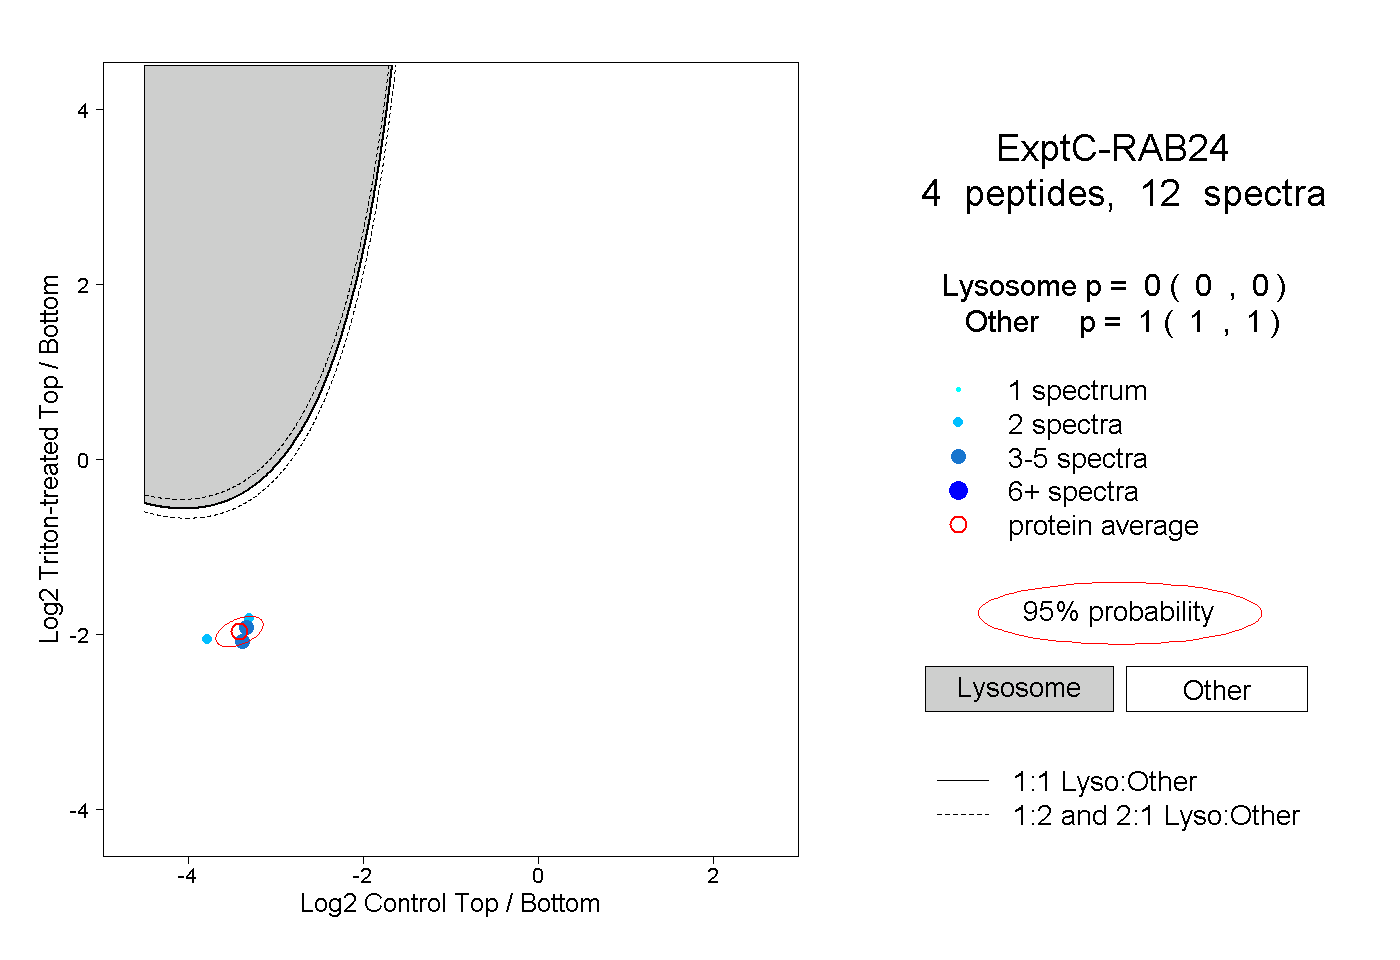 |
0.000 0.000 | 0.000 |
1.000 1.000 | 1.000 |
||||||||
| Plot | Lyso | Other | |||||||||||
| Expt D |
1 peptide |
2 spectra |
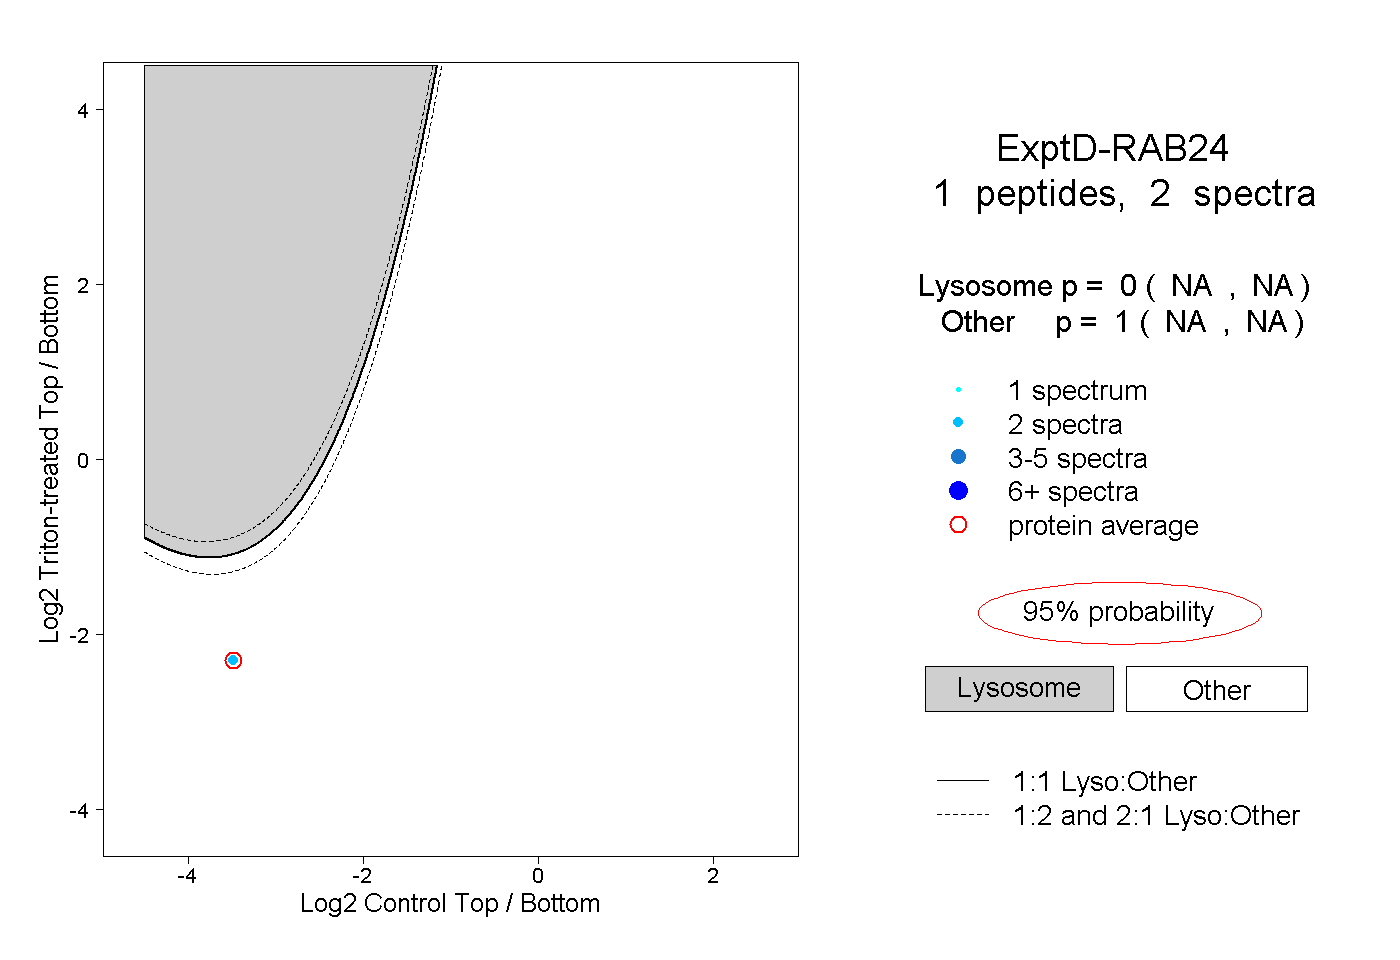 |
0.000 NA | NA |
1.000 NA | NA |