 6
6peptides
spectra
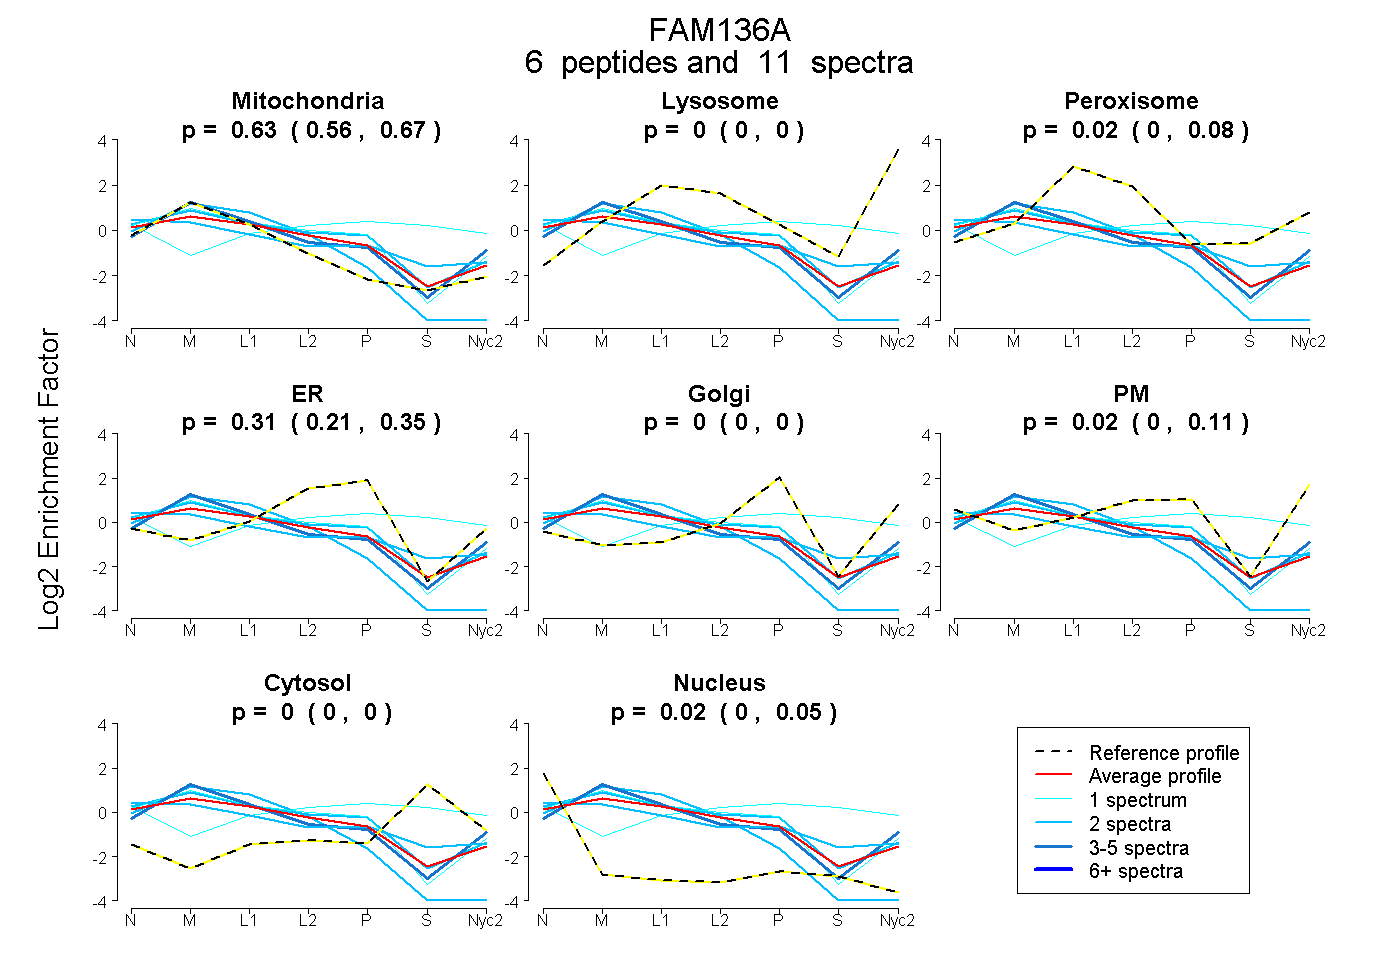
0.559 | 0.671
0.000 | 0.000
0.000 | 0.079
0.206 | 0.350
0.000 | 0.004
0.000 | 0.111
0.000 | 0.000
0.000 | 0.053
2peptides
spectra
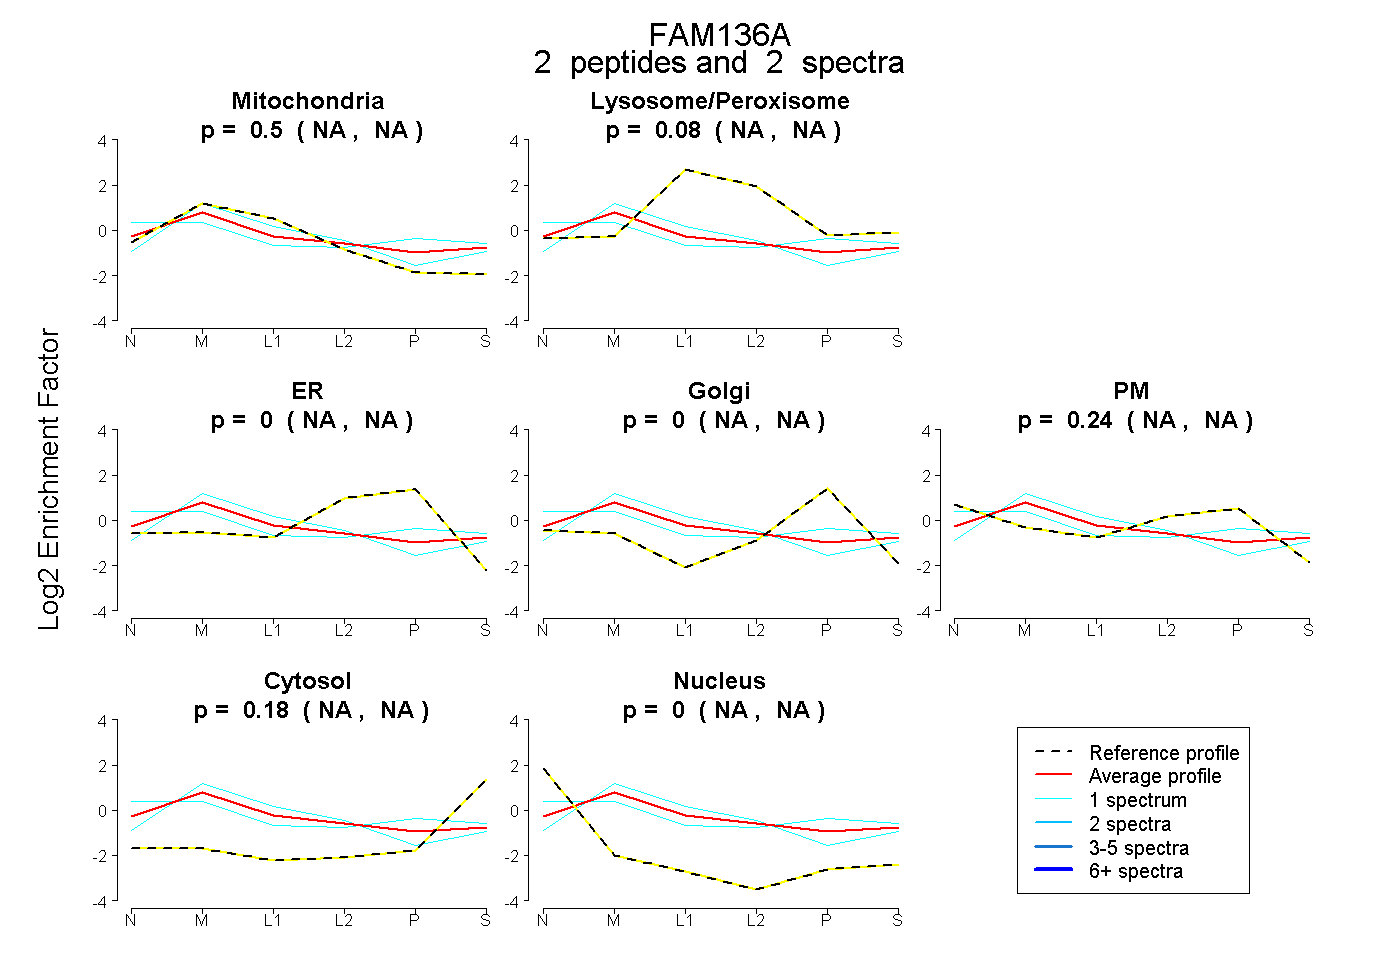
NA | NA
NA | NA
NA | NA
NA | NA
NA | NA
NA | NA
NA | NA
7peptides
spectra
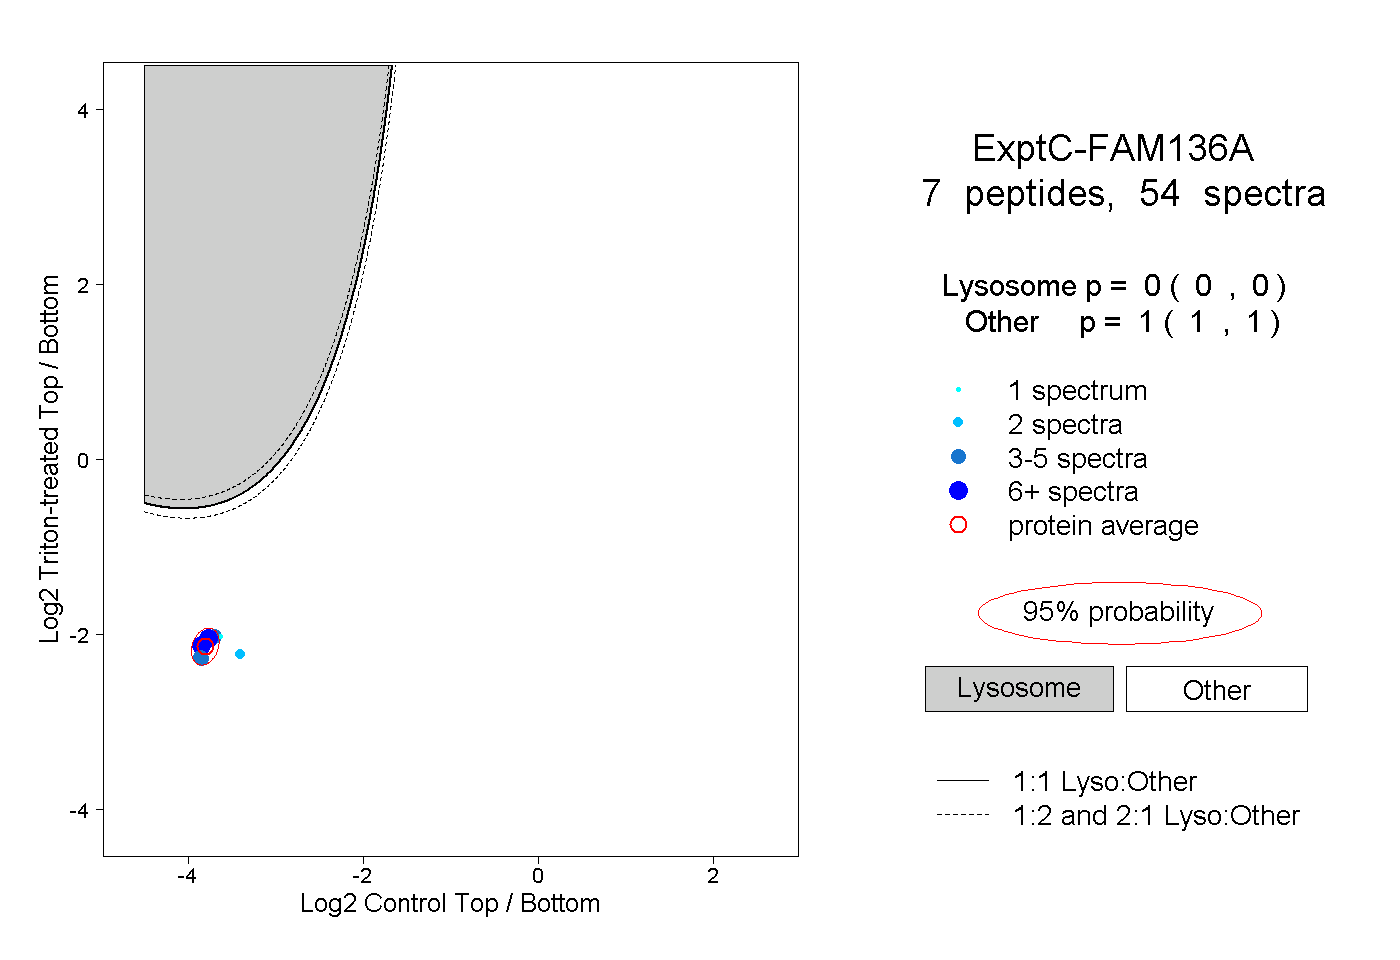
0.000 | 0.000
1.000 | 1.000
2peptides
spectra
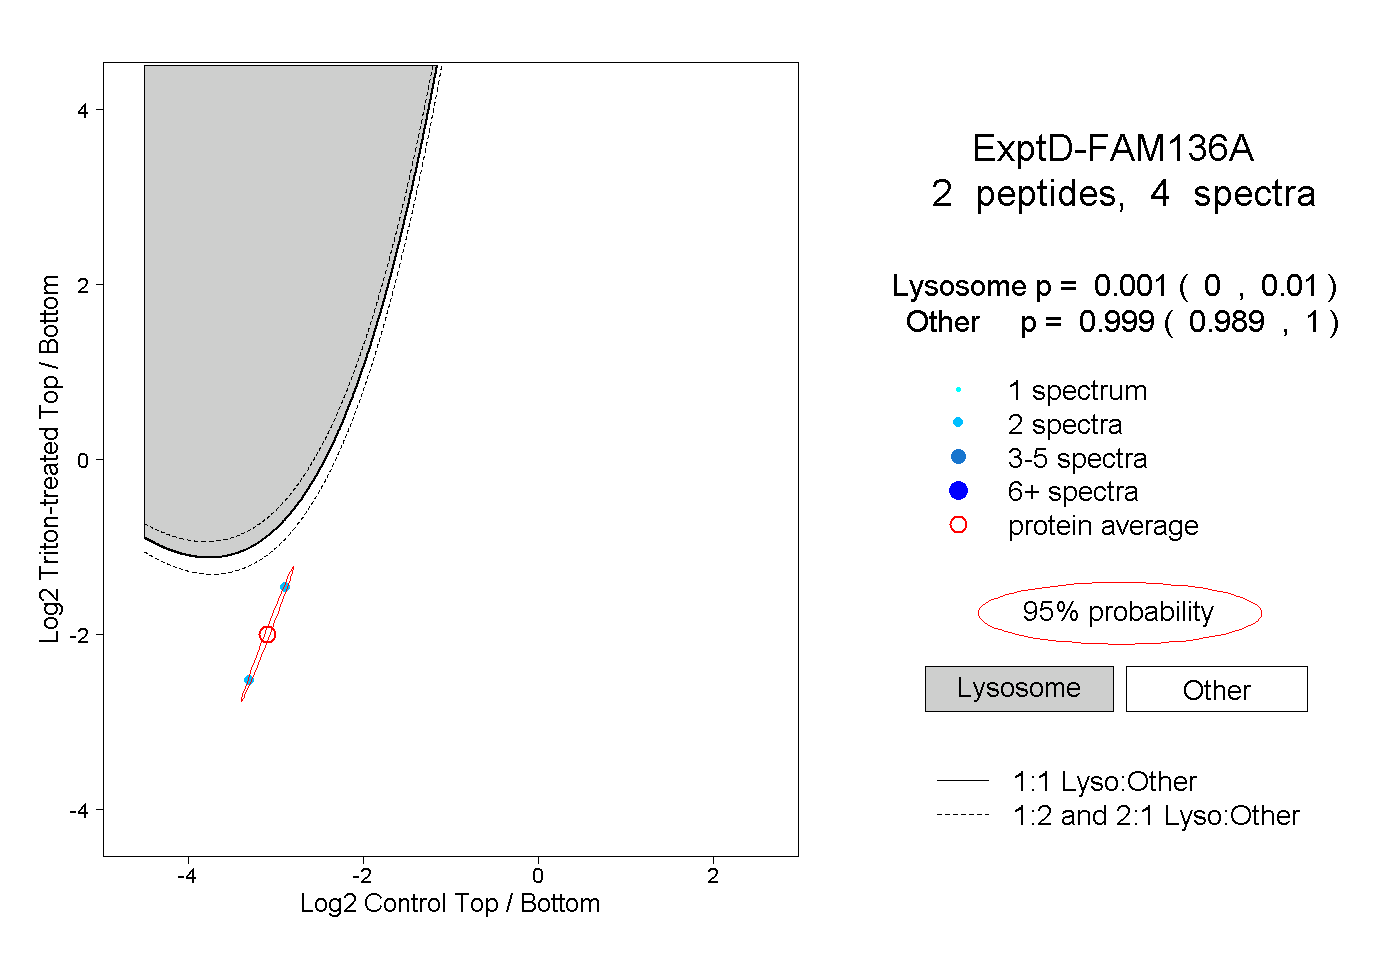
0.000 | 0.010
0.989 | 1.000