 8
8peptides
spectra
0.000 | 0.000
0.000 | 0.048
0.090 | 0.188
0.000 | 0.041
0.000 | 0.212
0.399 | 0.615
0.166 | 0.247
0.000 | 0.000
10peptides
spectra
0.000 | 0.000
1.000 | 1.000
| Plot | Mito | Lyso | Perox | ER | Golgi | PM | Cytosol | Nucleus | |||||
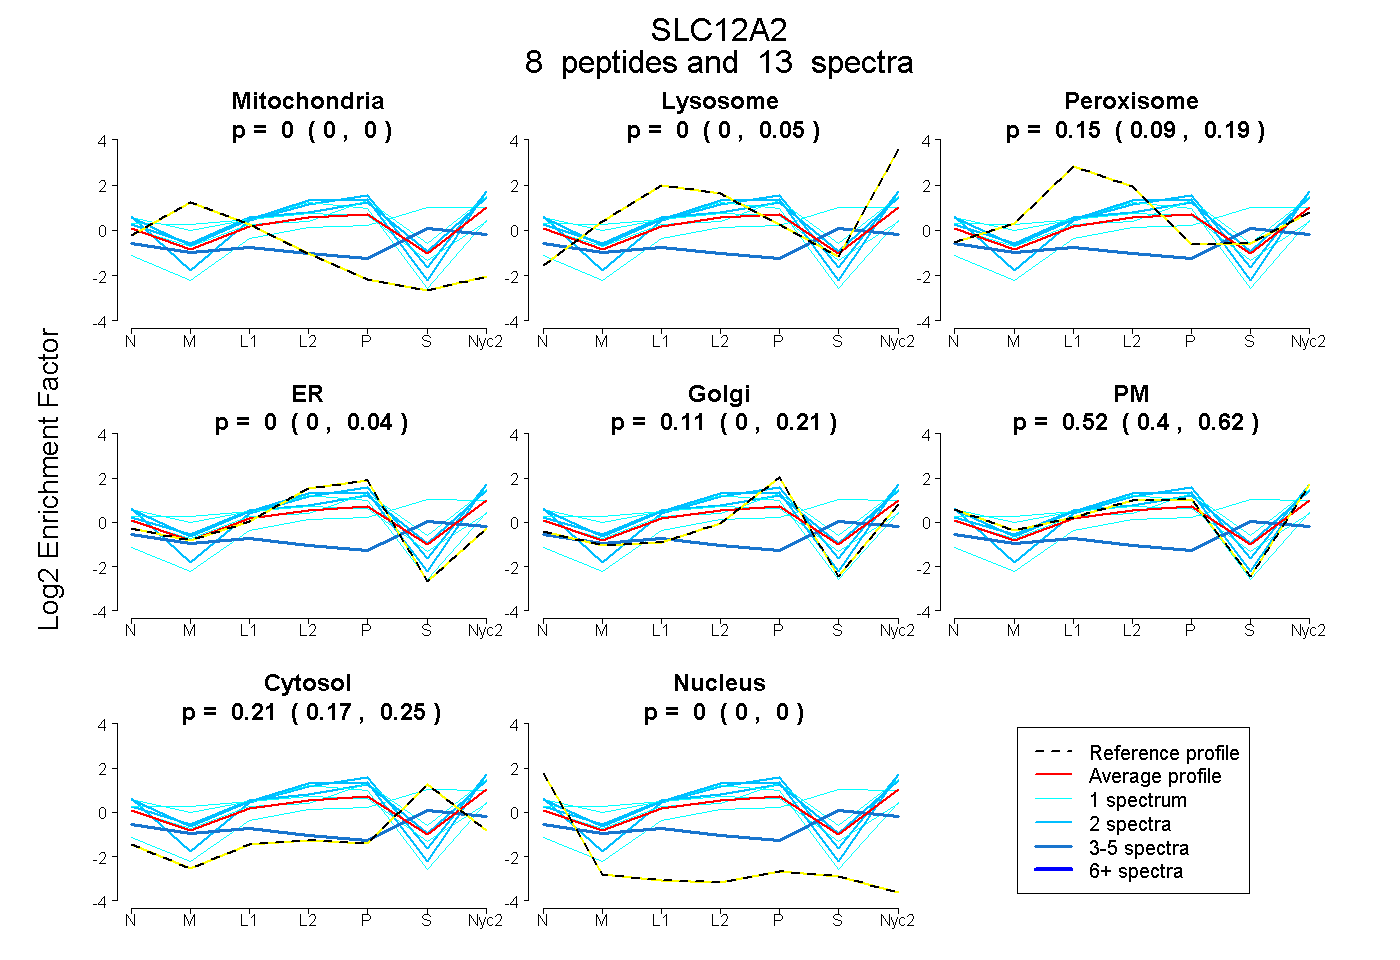
| Expt A |
8 peptides |
13 spectra |
|
0.000 0.000 | 0.000 |
0.004 0.000 | 0.048 |
0.153 0.090 | 0.188 |
0.000 0.000 | 0.041 |
0.112 0.000 | 0.212 |
0.521 0.399 | 0.615 |
0.210 0.166 | 0.247 |
0.000 0.000 | 0.000 |
||
| Plot | Lyso | Other | |||||||||||
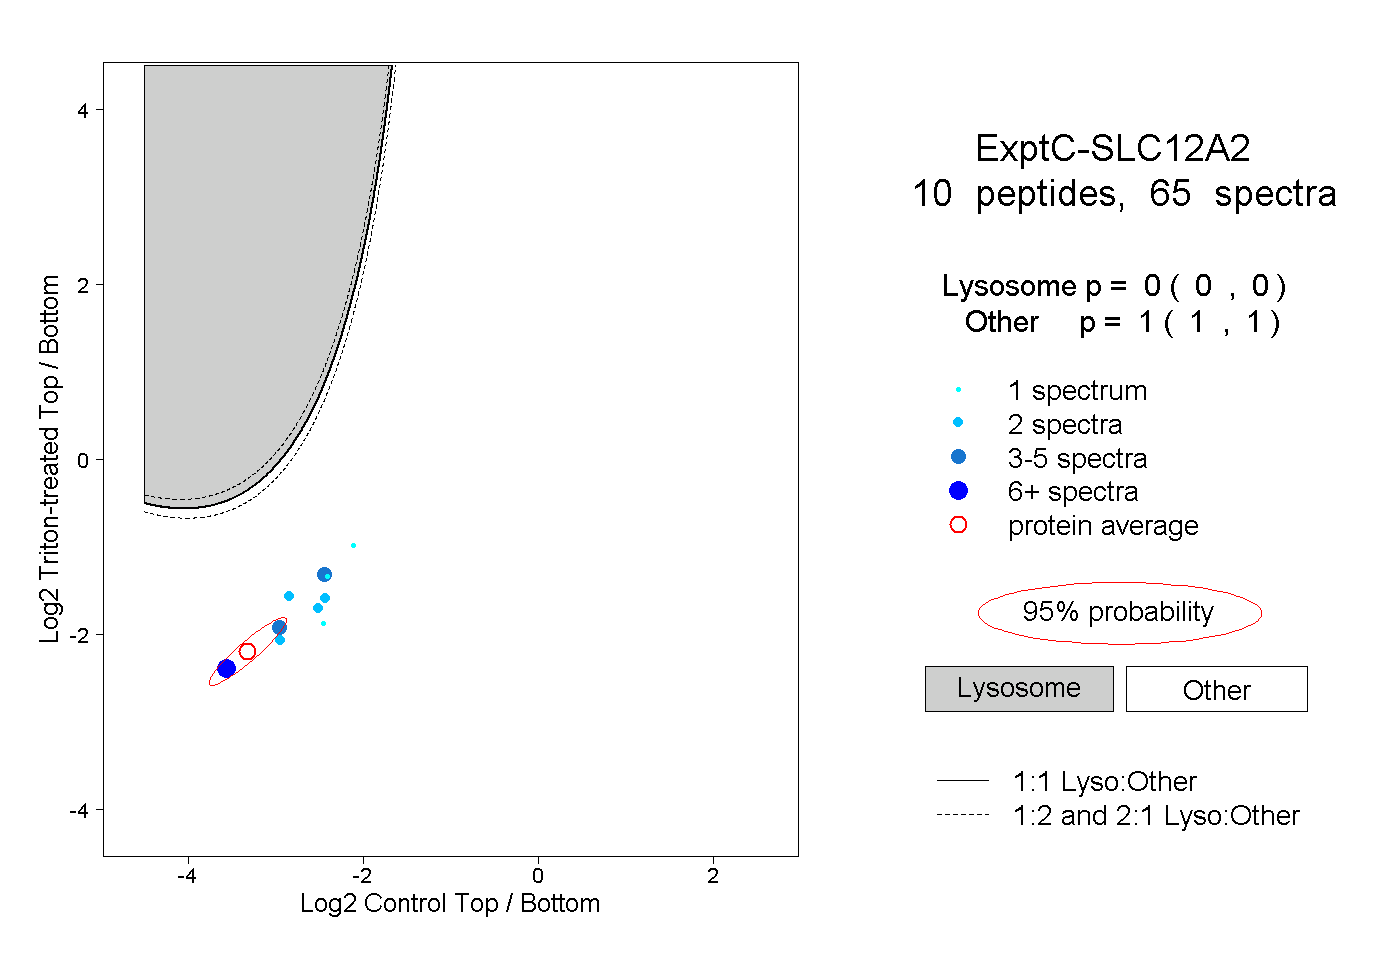
| Expt C |
10 peptides |
65 spectra |
|
0.000 0.000 | 0.000 |
1.000 1.000 | 1.000 |