 8
8peptides
spectra
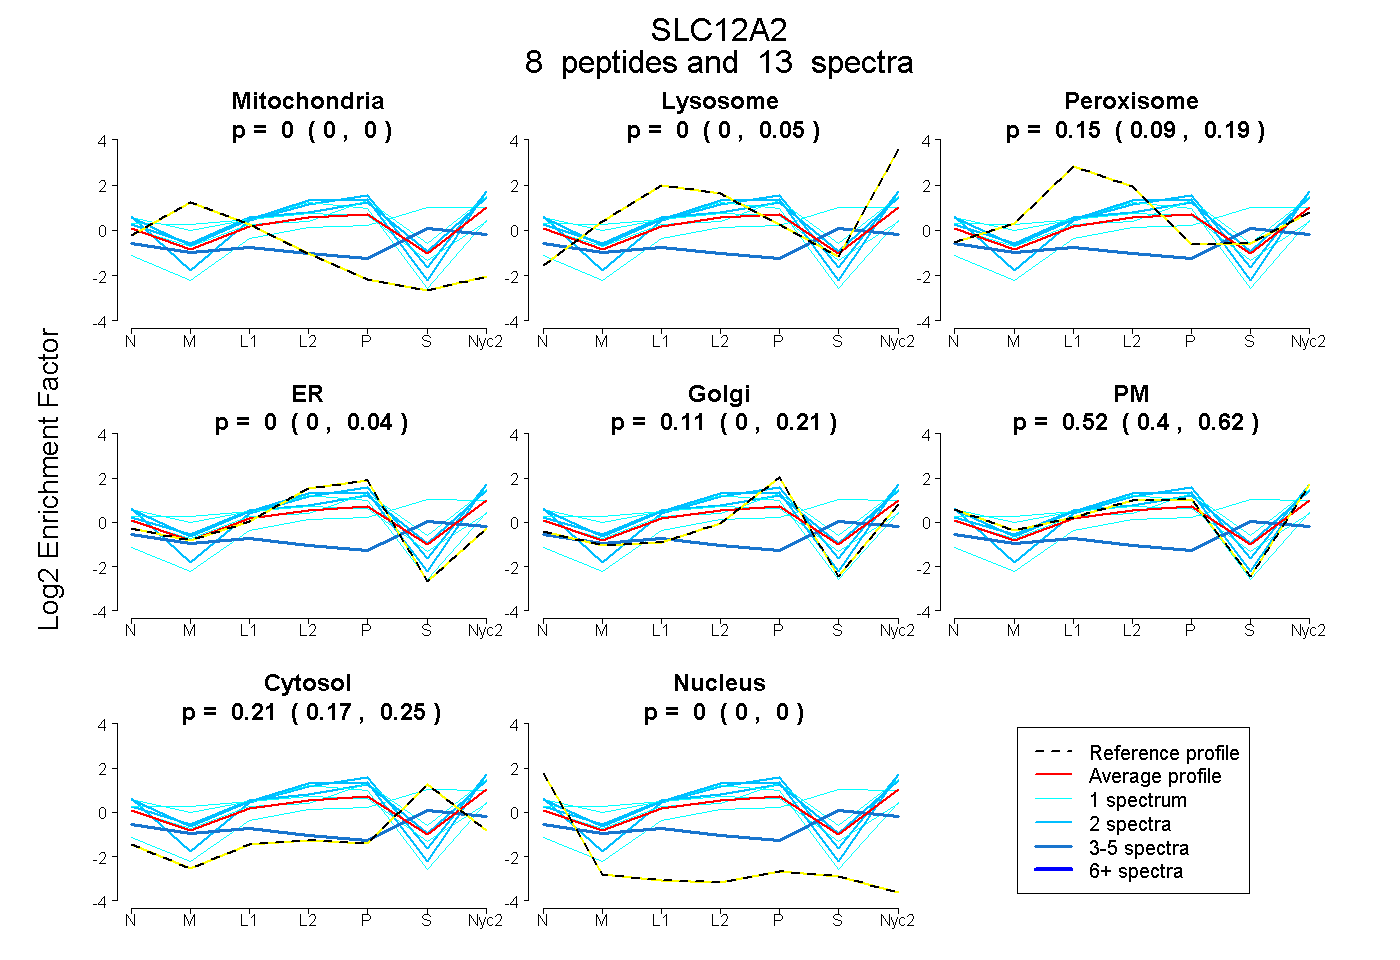
0.000 | 0.000
0.000 | 0.048
0.090 | 0.188
0.000 | 0.041
0.000 | 0.212
0.399 | 0.615
0.166 | 0.247
0.000 | 0.000
| Plot | Mito | Lyso | Perox | ER | Golgi | PM | Cytosol | Nucleus | |||||
| Expt A |
8 peptides |
13 spectra |
|
0.000 0.000 | 0.000 |
0.004 0.000 | 0.048 |
0.153 0.090 | 0.188 |
0.000 0.000 | 0.041 |
0.112 0.000 | 0.212 |
0.521 0.399 | 0.615 |
0.210 0.166 | 0.247 |
0.000 0.000 | 0.000 |
| 2 spectra, AFYAPVHADDLR | 0.000 | 0.091 | 0.167 | 0.000 | 0.178 | 0.468 | 0.096 | 0.000 | ||
| 1 spectrum, GPVAPLNVADQK | 0.129 | 0.000 | 0.255 | 0.087 | 0.133 | 0.348 | 0.048 | 0.000 | ||
| 2 spectra, ITDNELELYK | 0.000 | 0.058 | 0.008 | 0.095 | 0.000 | 0.840 | 0.000 | 0.000 | ||
| 1 spectrum, DVVVNVDYSK | 0.000 | 0.306 | 0.000 | 0.000 | 0.086 | 0.000 | 0.608 | 0.000 | ||
| 1 spectrum, IFQALCK | 0.108 | 0.000 | 0.062 | 0.329 | 0.000 | 0.501 | 0.000 | 0.000 | ||
| 3 spectra, VFIGGK | 0.203 | 0.096 | 0.000 | 0.000 | 0.000 | 0.101 | 0.581 | 0.019 | ||
| 2 spectra, EDATAGSQAGGGVR | 0.000 | 0.027 | 0.000 | 0.099 | 0.025 | 0.767 | 0.082 | 0.000 | ||
| 1 spectrum, EMSIDQAK | 0.000 | 0.185 | 0.049 | 0.000 | 0.227 | 0.357 | 0.182 | 0.000 |
| Plot | Lyso | Other | |||||||||||
| Expt C |
10 peptides |
65 spectra |
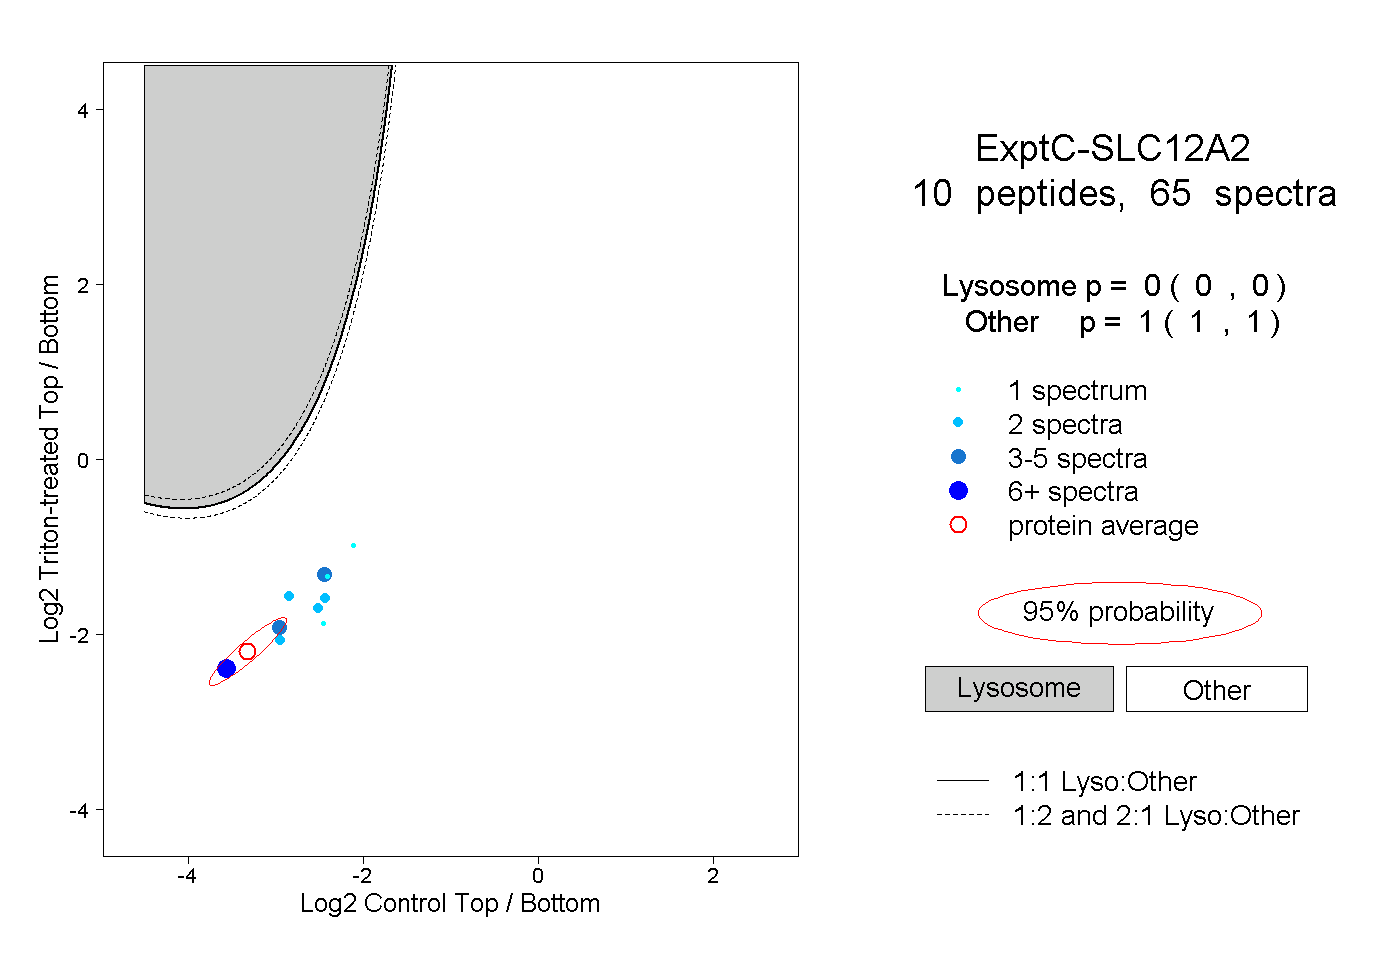 |
0.000 0.000 | 0.000 |
1.000 1.000 | 1.000 |