 13
13peptides
spectra
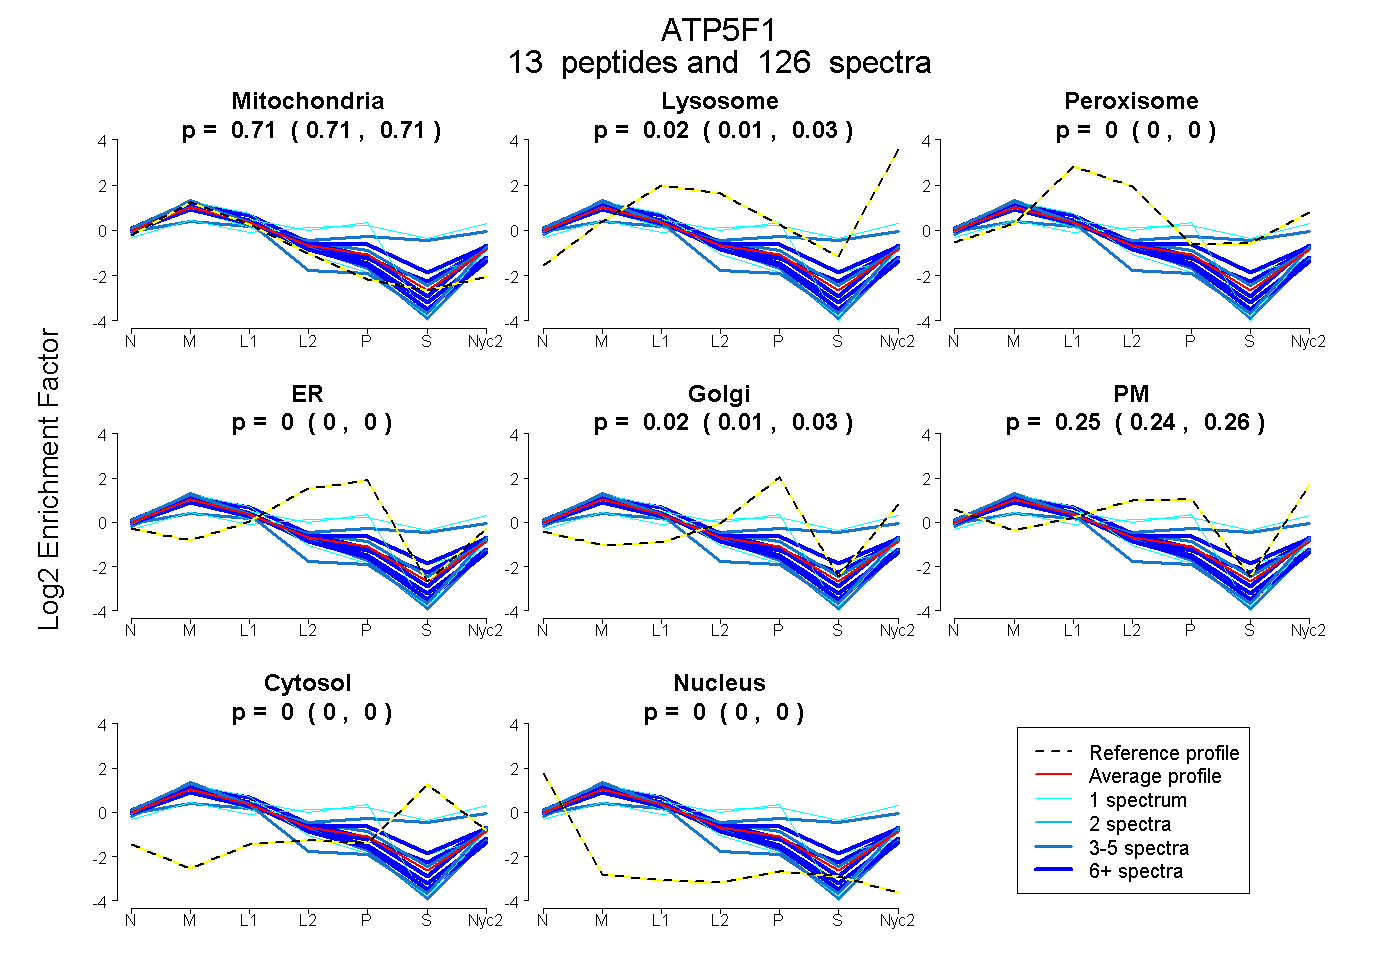
0.706 | 0.714
0.013 | 0.025
0.000 | 0.000
0.000 | 0.000
0.010 | 0.026
0.239 | 0.261
0.000 | 0.000
0.000 | 0.000
7peptides
spectra
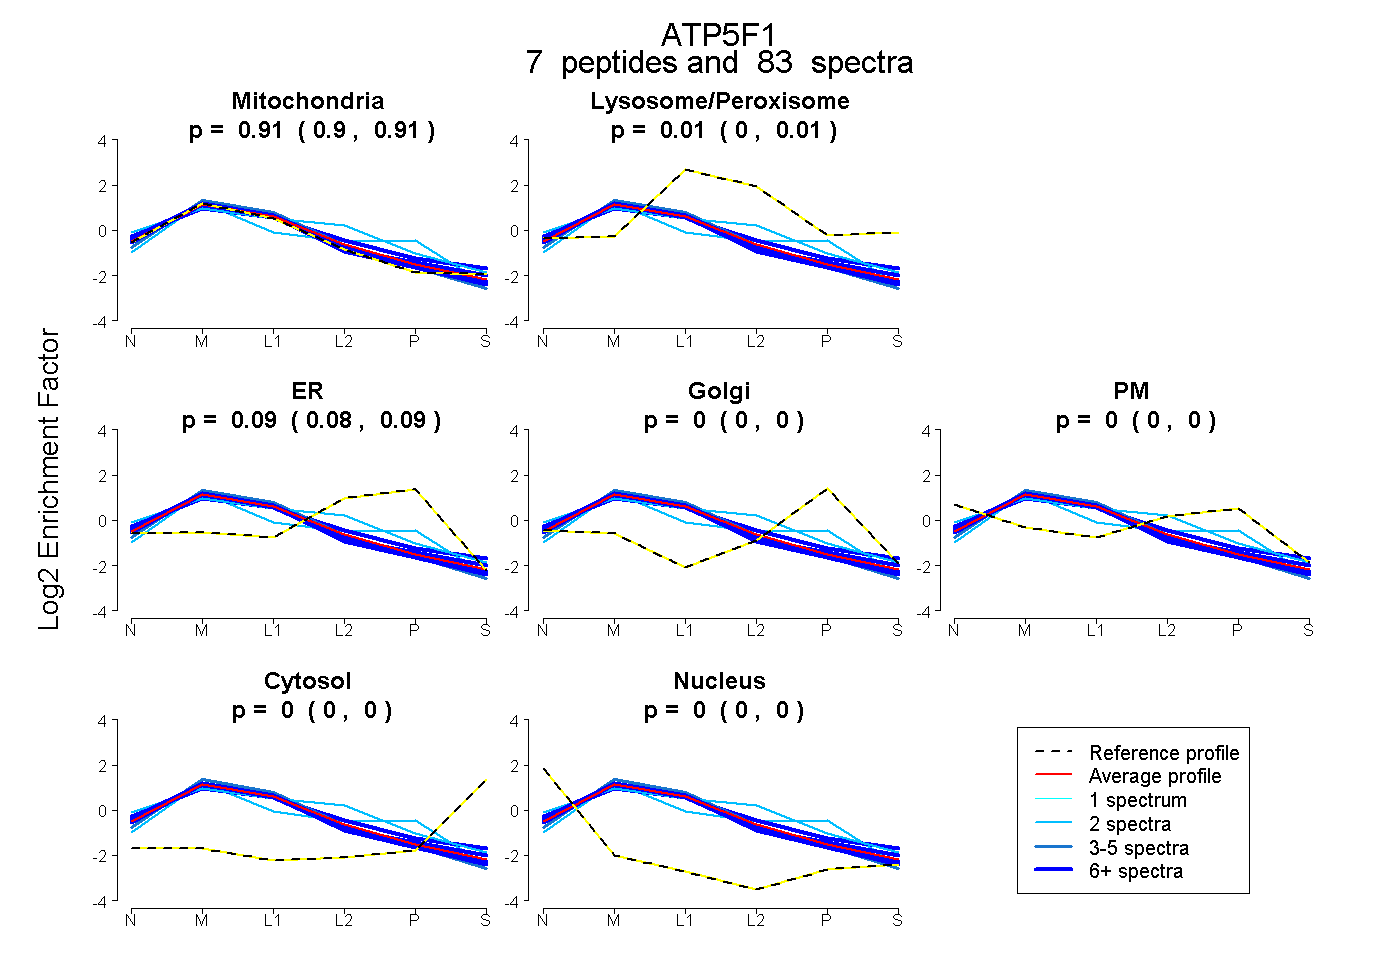
0.900 | 0.910
0.005 | 0.014
0.081 | 0.089
0.000 | 0.000
0.000 | 0.000
0.000 | 0.000
0.000 | 0.000
12peptides
spectra
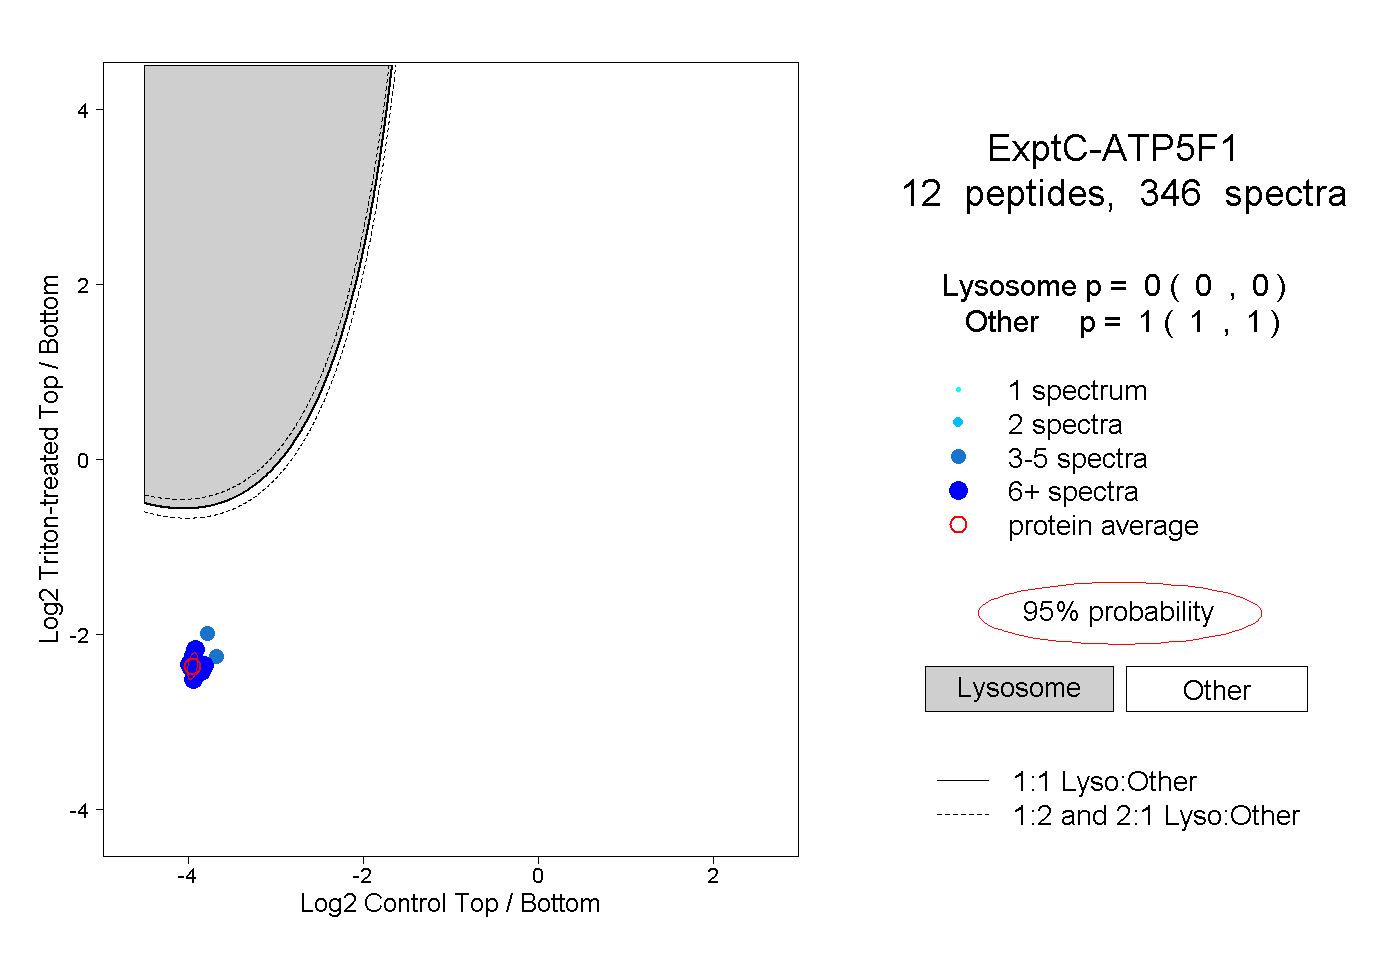
0.000 | 0.000
1.000 | 1.000
8peptides
spectra
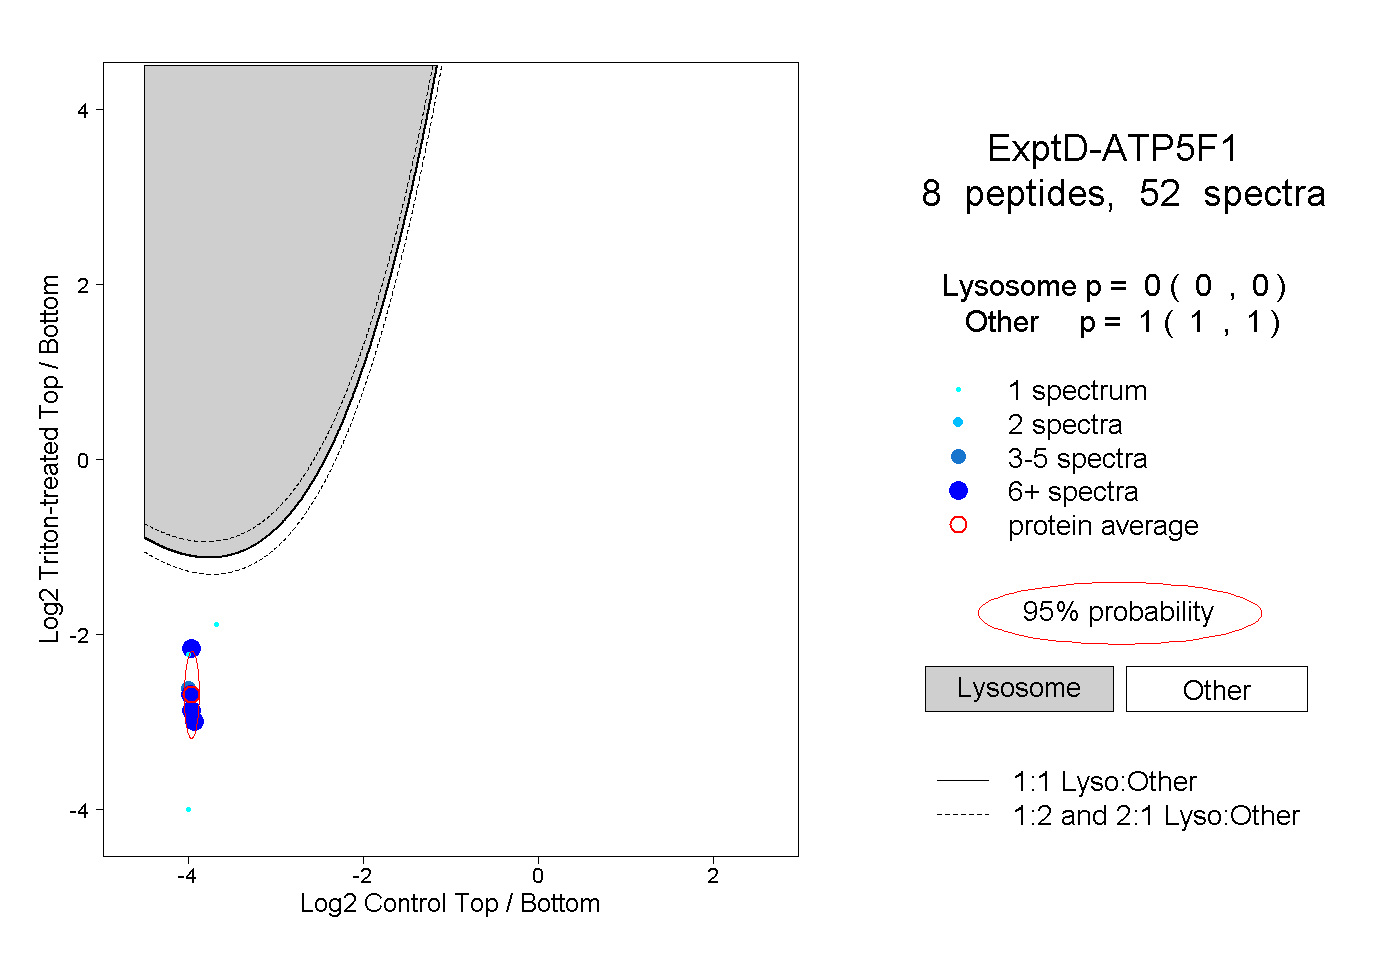
0.000 | 0.000
1.000 | 1.000