ATP5F1
[ENSRNOP00000021920]
Main page
| | | Plot |
Mito |
Lyso |
|
Perox |
ER |
Golgi |
PM |
Cytosol |
Nucleus |
|
| Expt A |
 13
13
peptides |
126
spectra |
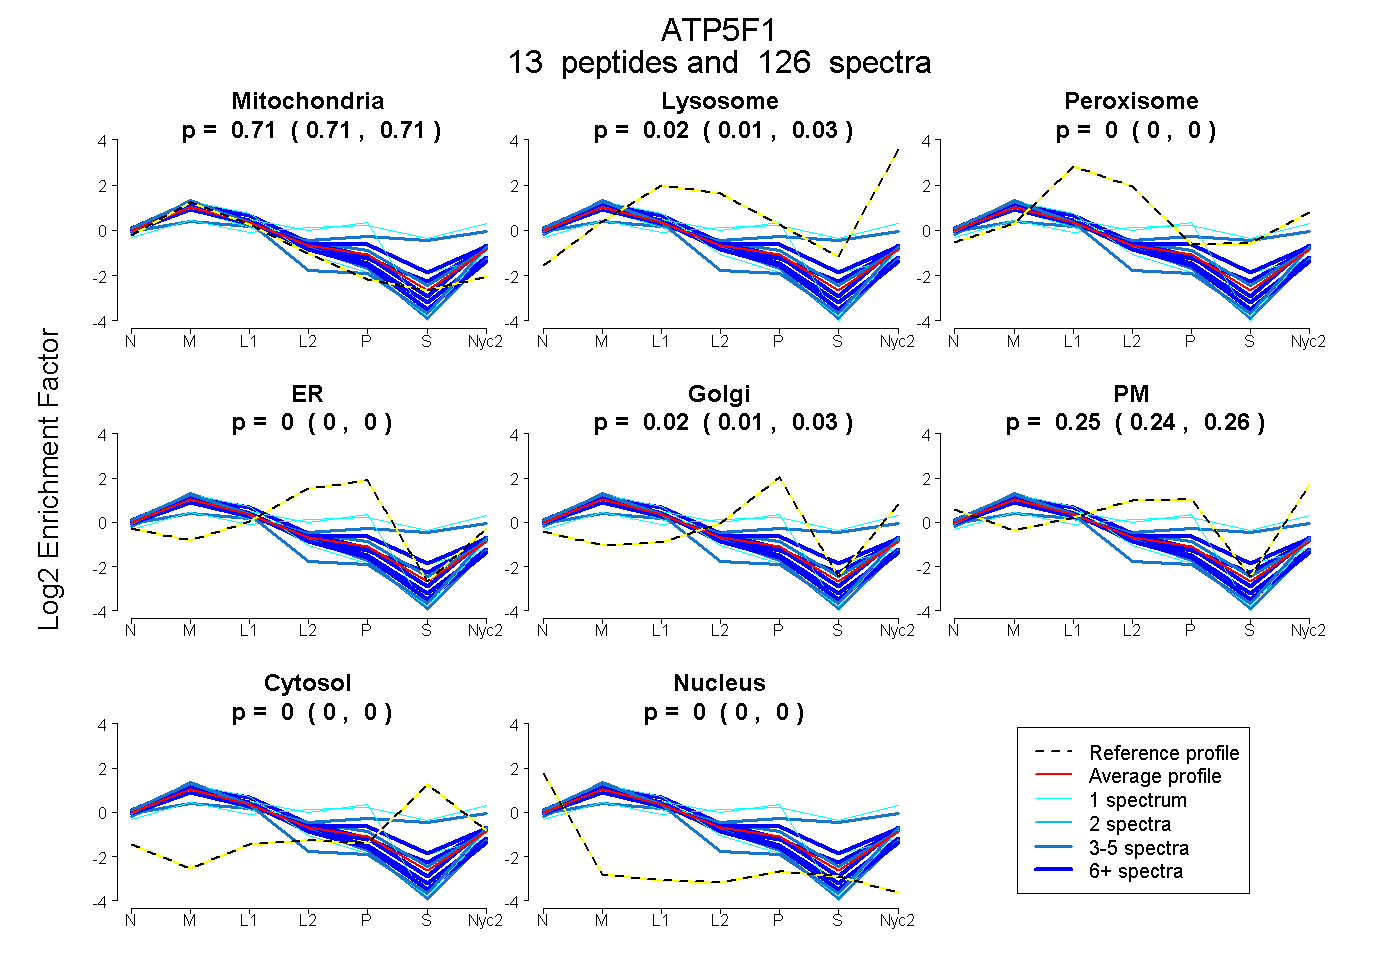 |
0.711
0.706 | 0.714 |
0.020
0.013 | 0.025 |
|
0.000
0.000 | 0.000 |
0.000
0.000 | 0.000 |
0.018
0.010 | 0.026 |
0.251
0.239 | 0.261 |
0.000
0.000 | 0.000 |
0.000
0.000 | 0.000 |
|
| | | Plot |
Mito |
|
Lyso or Perox |
|
ER |
Golgi |
PM |
Cytosol |
Nucleus |
|
| Expt B |
7
peptides |
83
spectra |
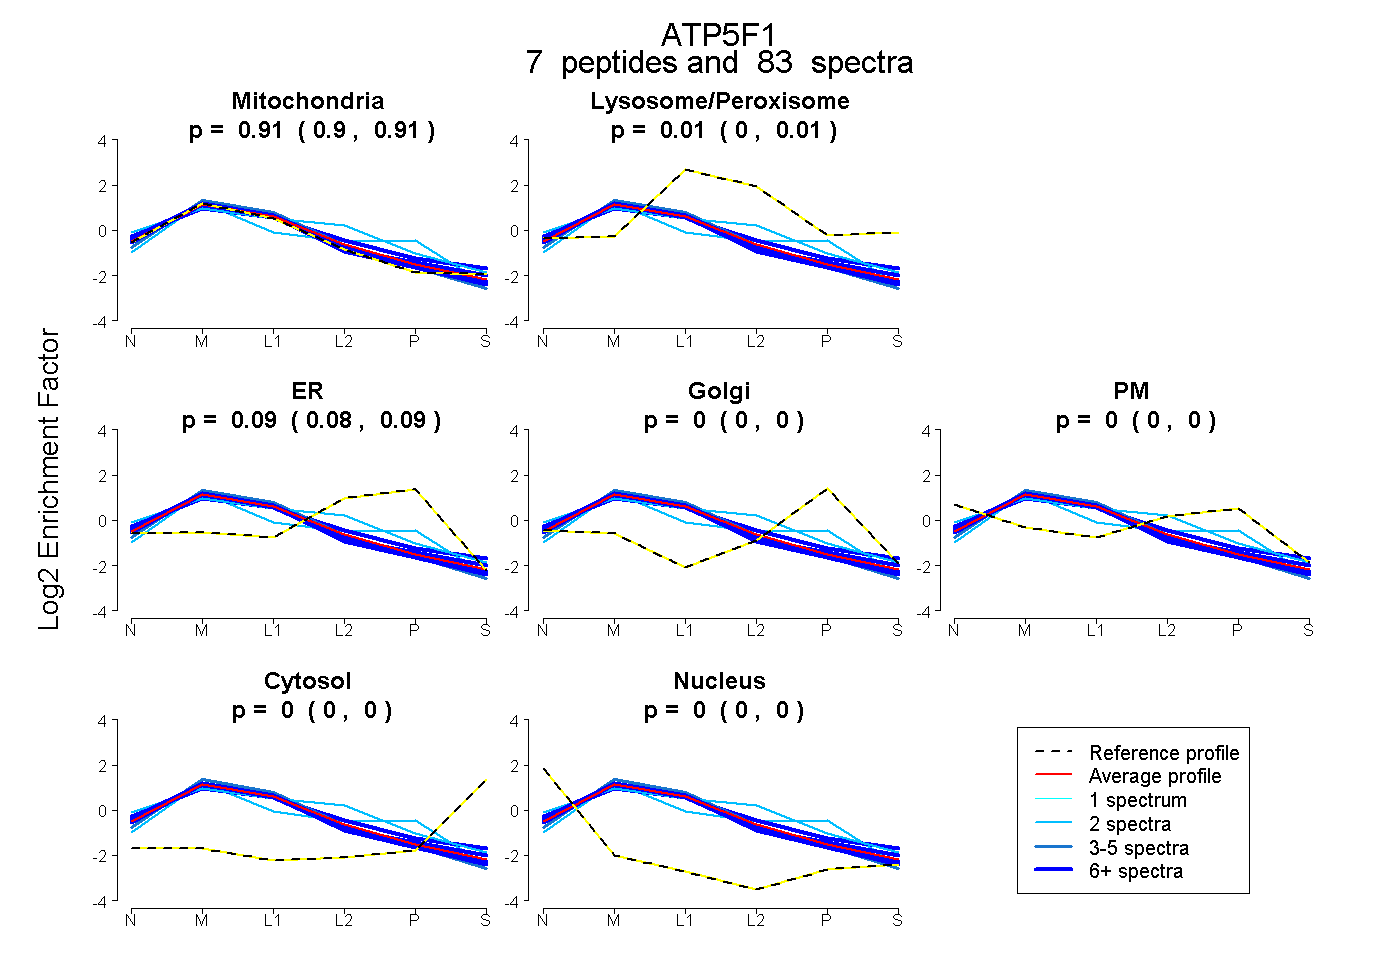 |
0.905
0.900 | 0.910 |
|
0.009
0.005 | 0.014 |
|
0.085
0.081 | 0.089 |
0.000
0.000 | 0.000 |
0.000
0.000 | 0.000 |
0.000
0.000 | 0.000 |
0.000
0.000 | 0.000 |
|
| | | Plot |
|
Lyso |
|
|
|
|
|
|
|
Other |
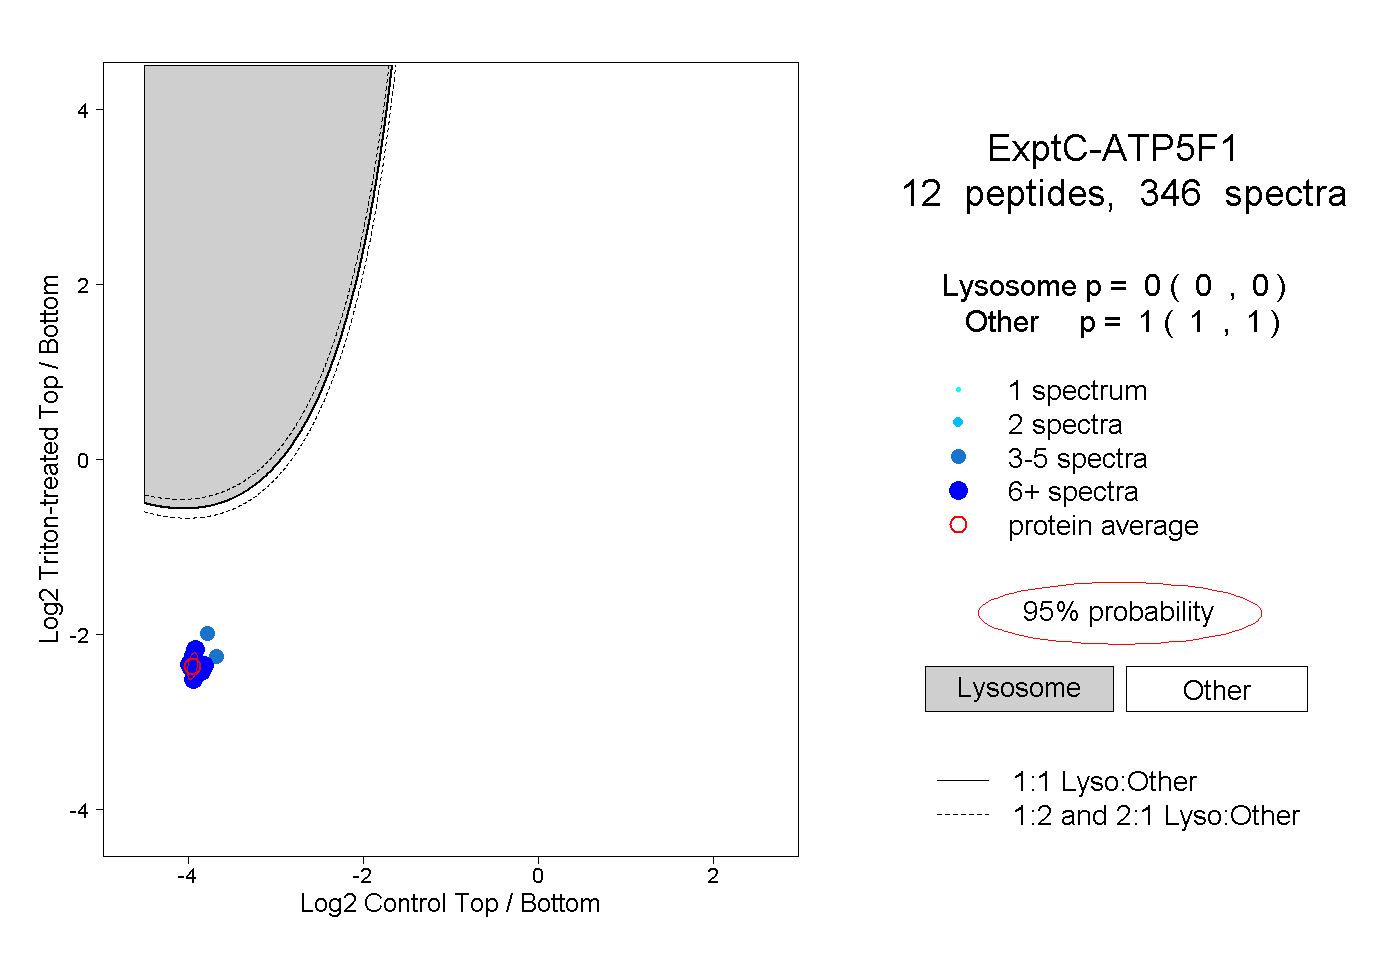
| Expt C |
12
peptides |
346
spectra |
 |
|
0.000
0.000 | 0.000 |
|
|
|
|
|
|
|
1.000
1.000 | 1.000 |
| | | Plot |
|
Lyso |
|
|
|
|
|
|
|
Other |
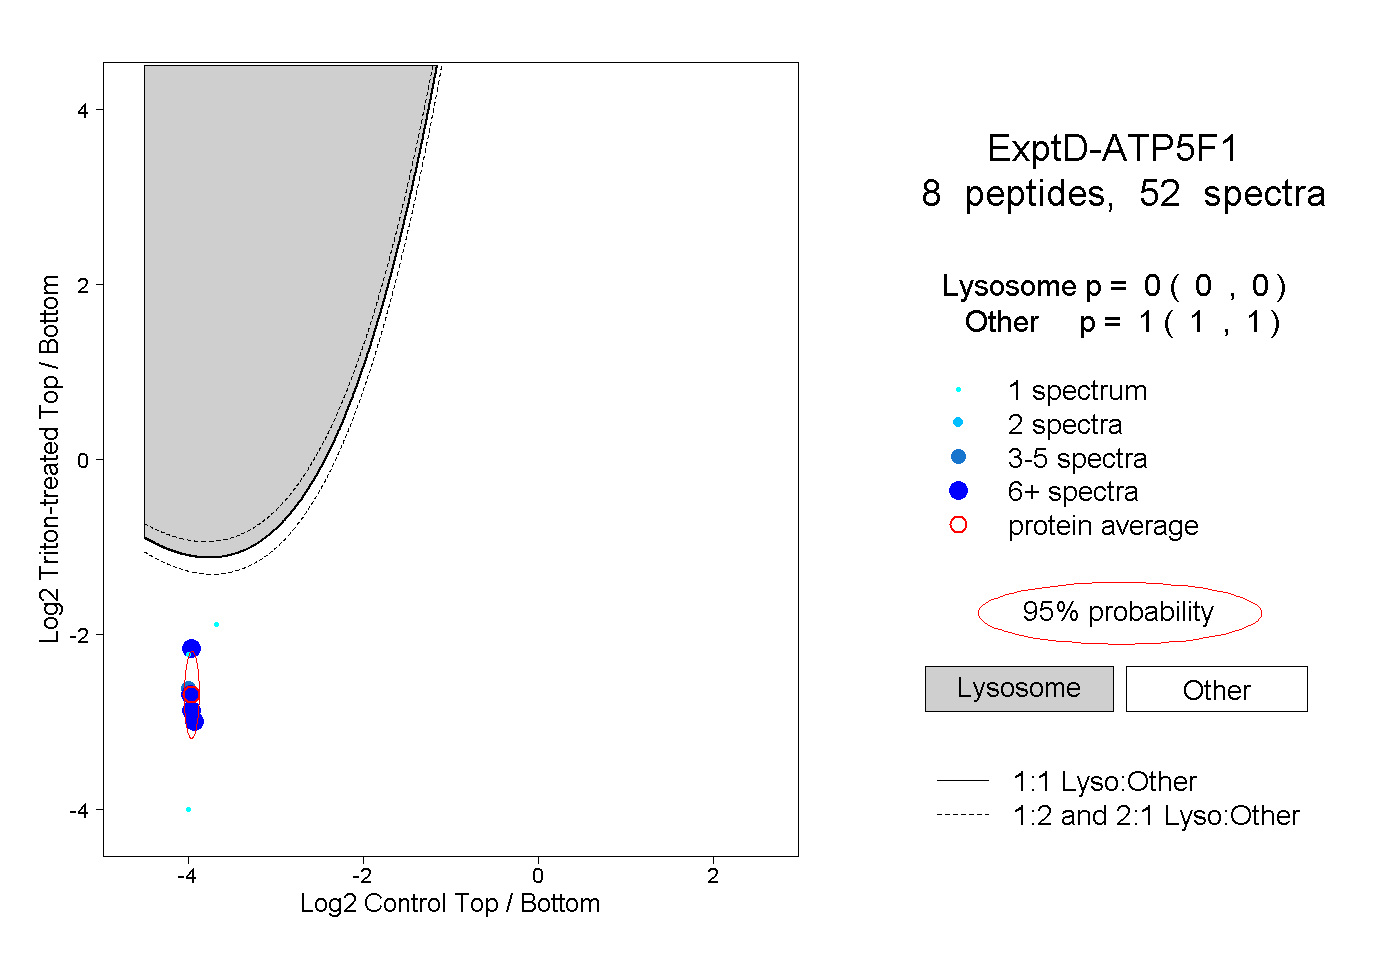
| Expt D |
8
peptides |
52
spectra |
 |
|
0.000
0.000 | 0.000 |
|
|
|
|
|
|
|
1.000
1.000 | 1.000 |
| 1 spectrum, YGASIGEFIDK |
|
0.000 |
|
|
|
|
|
|
|
1.000 |
| 20 spectra, QIQDAINR |
|
0.000 |
|
|
|
|
|
|
|
1.000 |
| 7 spectra, AQQALVQK |
|
0.000 |
|
|
|
|
|
|
|
1.000 |
| 11 spectra, HYLFDVQR |
|
0.000 |
|
|
|
|
|
|
|
1.000 |
| 1 spectrum, AQAQPIM |
|
0.004 |
|
|
|
|
|
|
|
0.996 |
| 7 spectra, CIGDLK |
|
0.000 |
|
|
|
|
|
|
|
1.000 |
| 4 spectra, IAQLEEIK |
|
0.000 |
|
|
|
|
|
|
|
1.000 |
| 1 spectrum, HVIQSISAQQEK |
|
0.000 |
|
|
|
|
|
|
|
1.000 |