 5
5peptides
spectra

0.000 | 0.000
0.669 | 0.720
0.000 | 0.000
0.000 | 0.000
0.000 | 0.018
0.266 | 0.324
0.000 | 0.000
0.000 | 0.000
8peptides
spectra
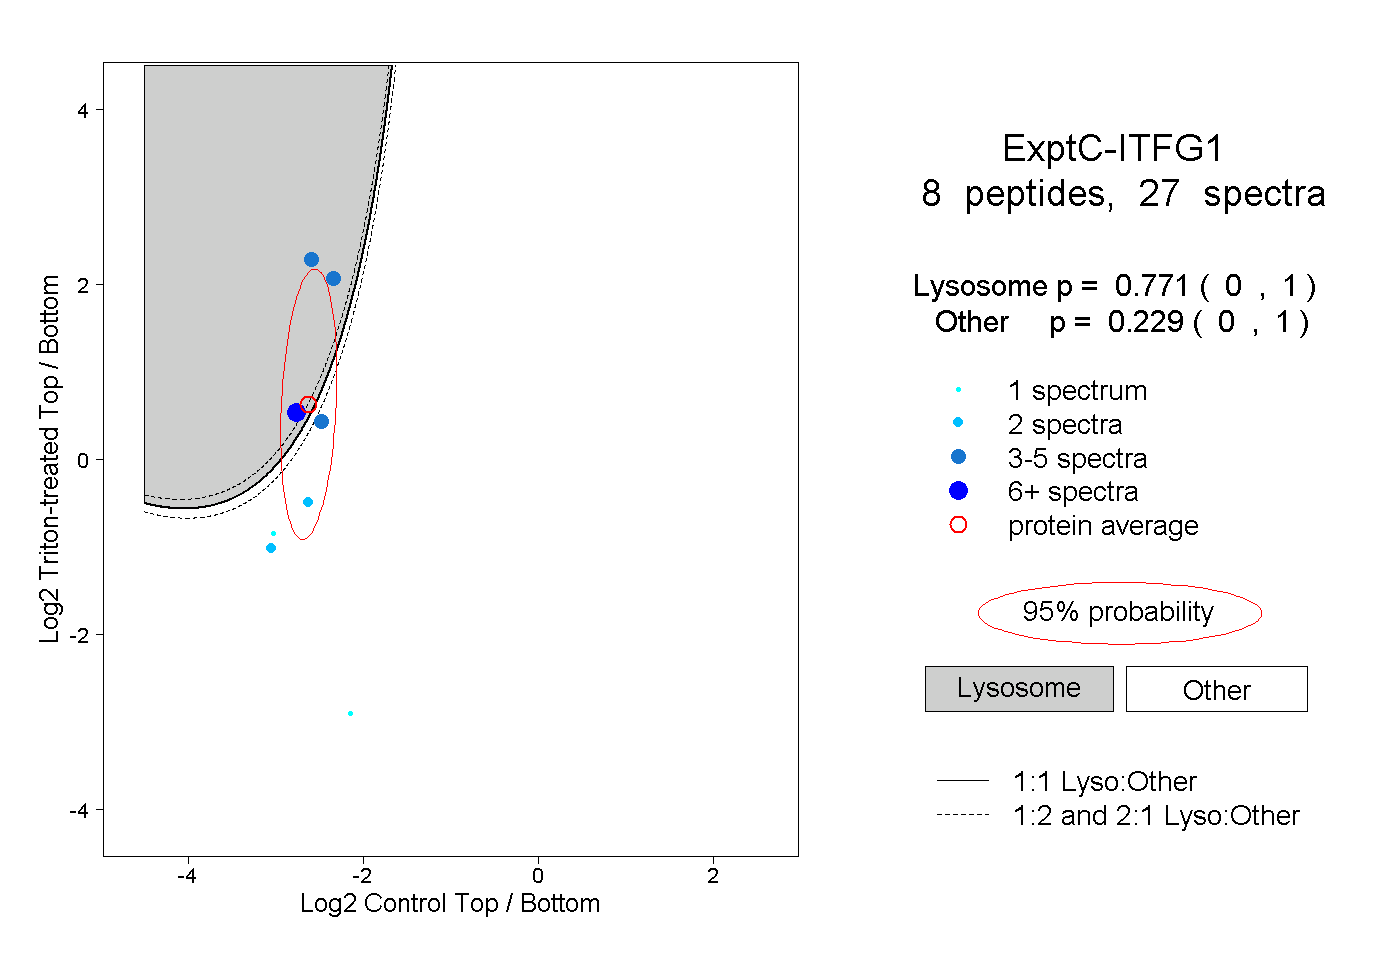
0.000 | 1.000
0.000 | 1.000
3peptides
spectra
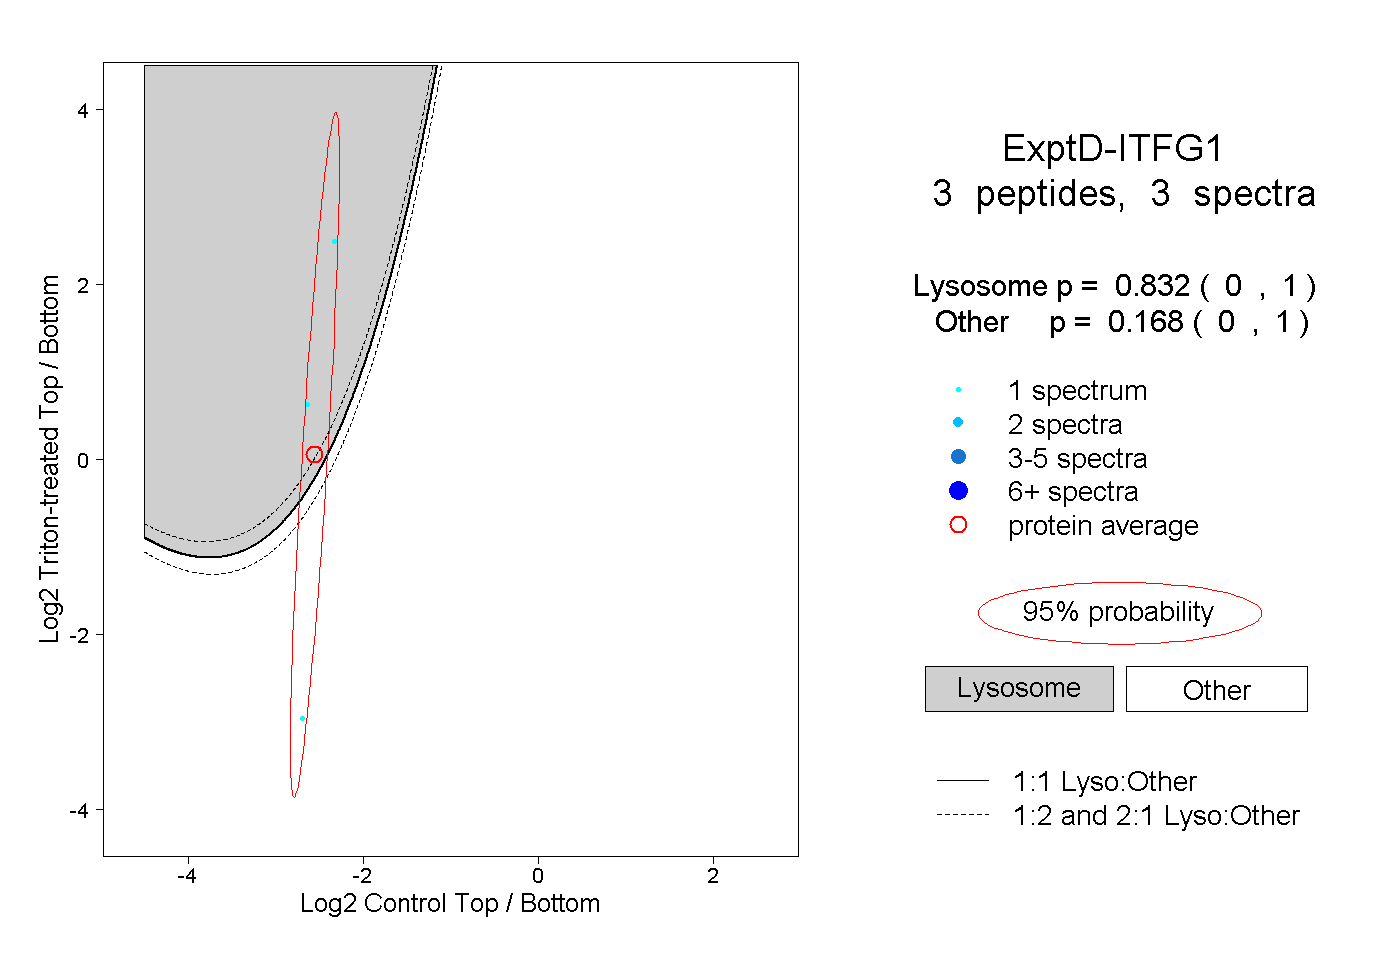
0.000 | 1.000
0.000 | 1.000