 5
5peptides
spectra

0.000 | 0.000
0.669 | 0.720
0.000 | 0.000
0.000 | 0.000
0.000 | 0.018
0.266 | 0.324
0.000 | 0.000
0.000 | 0.000
8peptides
spectra
0.000 | 1.000
0.000 | 1.000
| Plot | Mito | Lyso | Perox | ER | Golgi | PM | Cytosol | Nucleus | |||||
| Expt A |
5 peptides |
10 spectra |
|
0.000 0.000 | 0.000 |
0.697 0.669 | 0.720 |
0.000 0.000 | 0.000 |
0.000 0.000 | 0.000 |
0.000 0.000 | 0.018 |
0.303 0.266 | 0.324 |
0.000 0.000 | 0.000 |
0.000 0.000 | 0.000 |
||
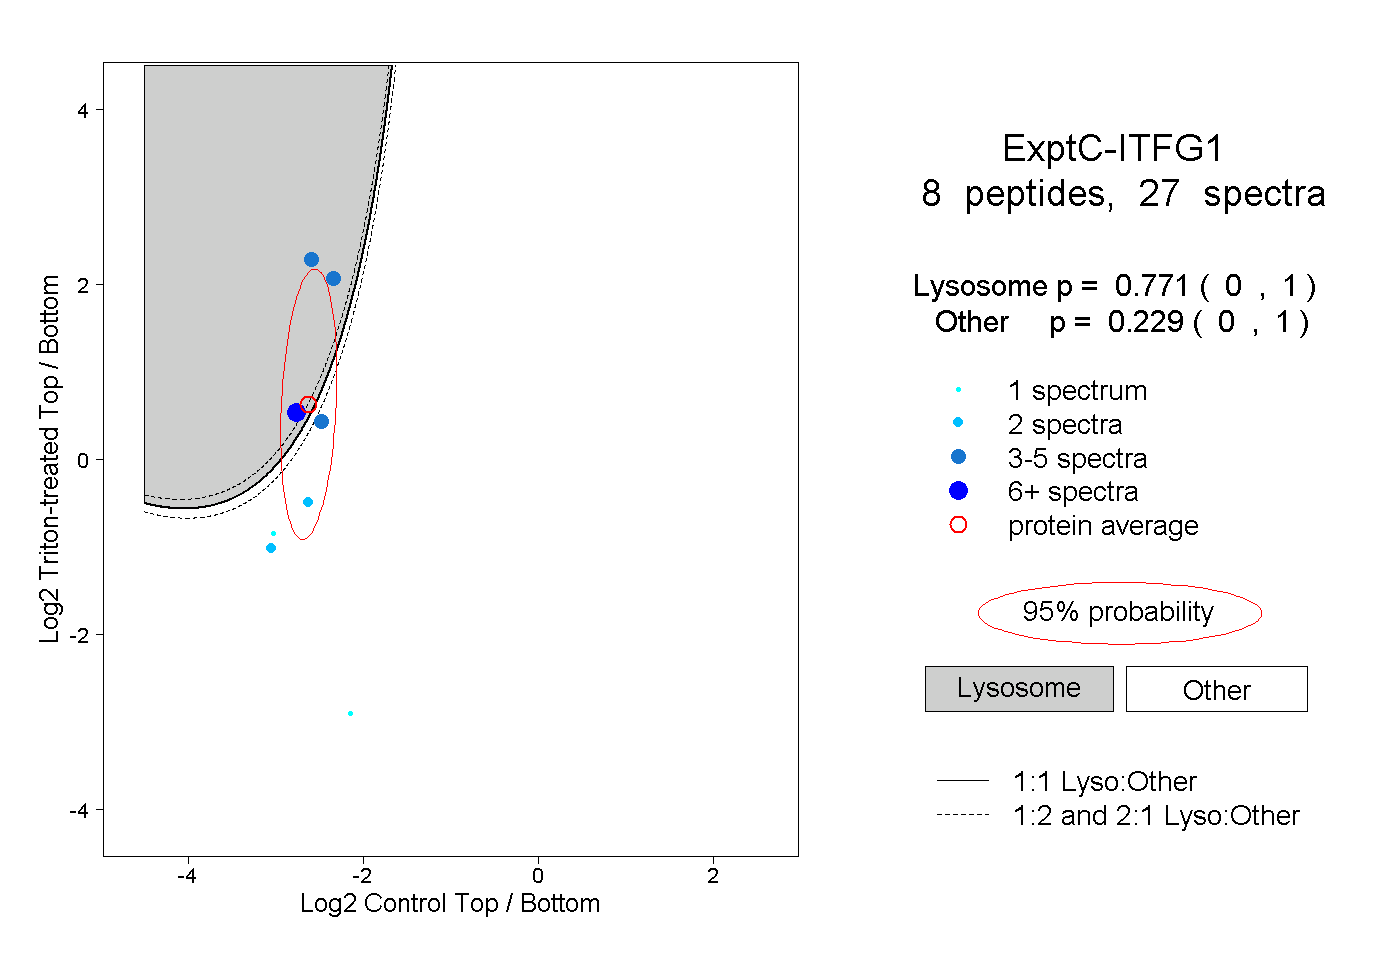
| Plot | Lyso | Other | |||||||||||
| Expt C |
8 peptides |
27 spectra |
|
0.771 0.000 | 1.000 |
0.229 0.000 | 1.000 |
| 8 spectra, SAIYLMR | 0.926 | 0.074 | ||||||||
| 2 spectra, SGTGQWAPVLQDFSNK | 0.000 | 1.000 | ||||||||
| 4 spectra, QTDLFVLR | 0.999 | 0.001 | ||||||||
| 1 spectrum, SVFEKPK | 0.000 | 1.000 | ||||||||
| 5 spectra, FHFDAM | 0.068 | 0.932 | ||||||||
| 1 spectrum, VYWDLAGLNLIK | 0.001 | 0.999 | ||||||||
| 2 spectra, VIVLSGLCSSDCPR | 0.000 | 1.000 | ||||||||
| 4 spectra, SDVAIHTLK | 1.000 | 0.000 |
| Plot | Lyso | Other | |||||||||||
| Expt D |
3 peptides |
3 spectra |
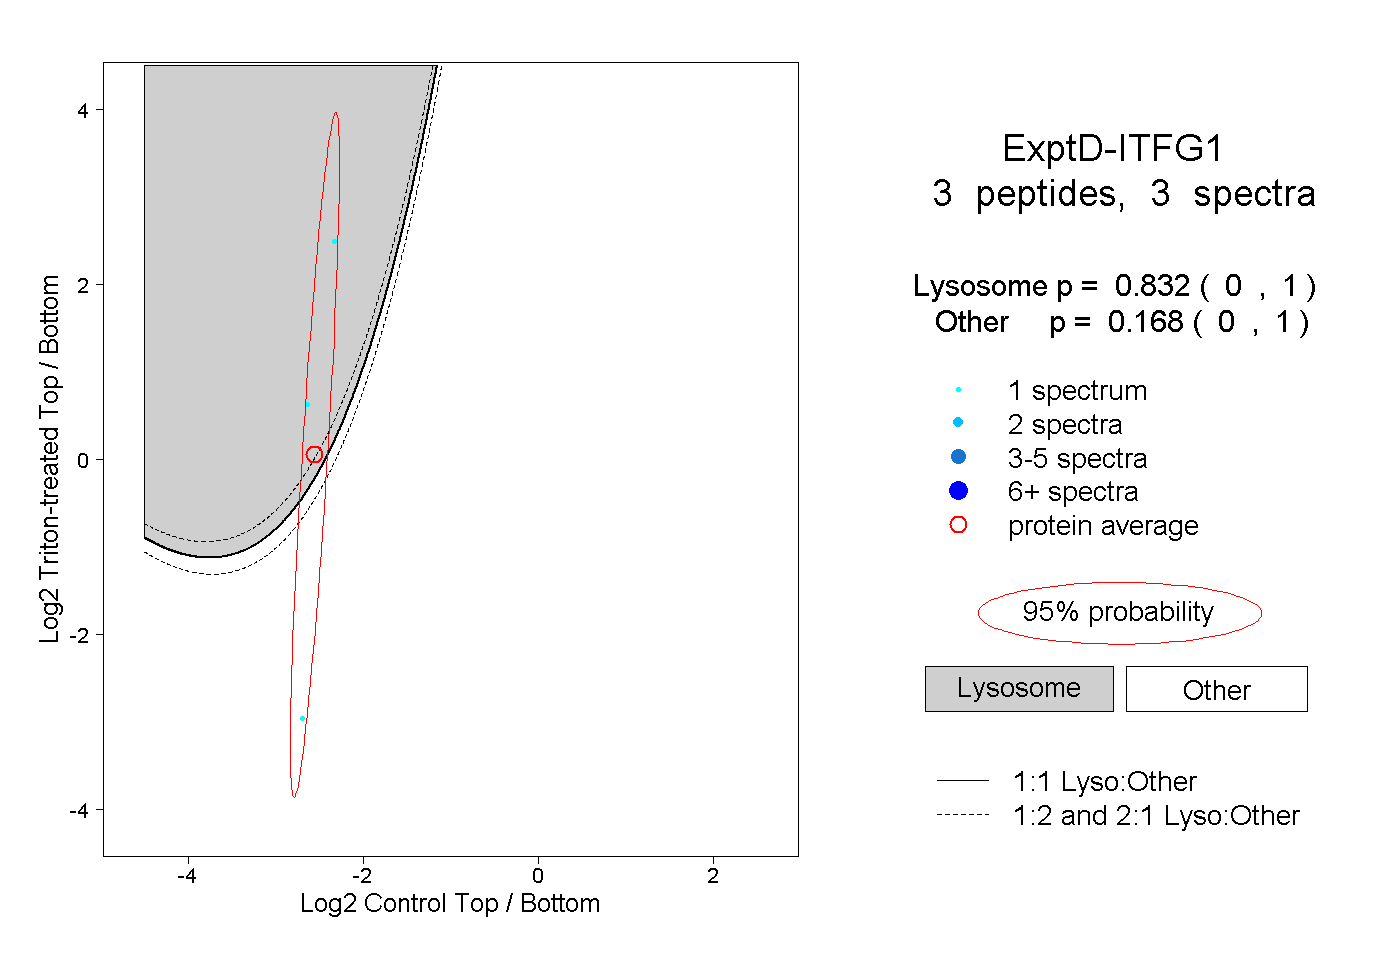 |
0.832 0.000 | 1.000 |
0.168 0.000 | 1.000 |