 5
5peptides
spectra
0.000 | 0.092
0.000 | 0.000
0.000 | 0.000
0.000 | 0.113
0.231 | 0.435
0.000 | 0.000
0.142 | 0.220
0.327 | 0.459
1peptide
spectrum
NA | NA
NA | NA
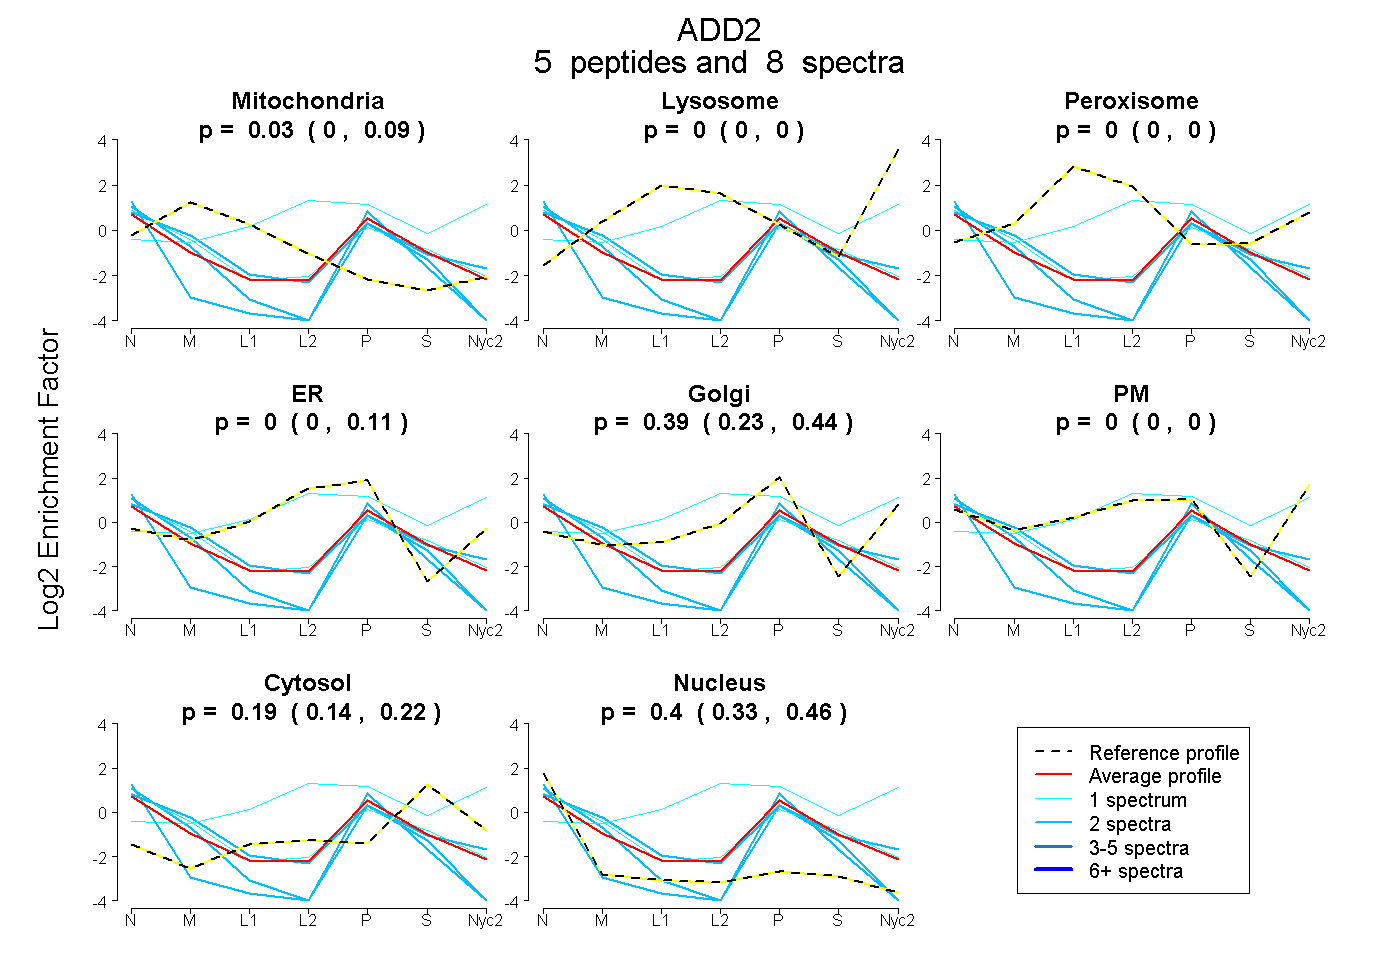
| Plot | Mito | Lyso | Perox | ER | Golgi | PM | Cytosol | Nucleus | |||||
| Expt A |
5 peptides |
8 spectra |
|
0.027 0.000 | 0.092 |
0.000 0.000 | 0.000 |
0.000 0.000 | 0.000 |
0.000 0.000 | 0.113 |
0.390 0.231 | 0.435 |
0.000 0.000 | 0.000 |
0.186 0.142 | 0.220 |
0.397 0.327 | 0.459 |
||
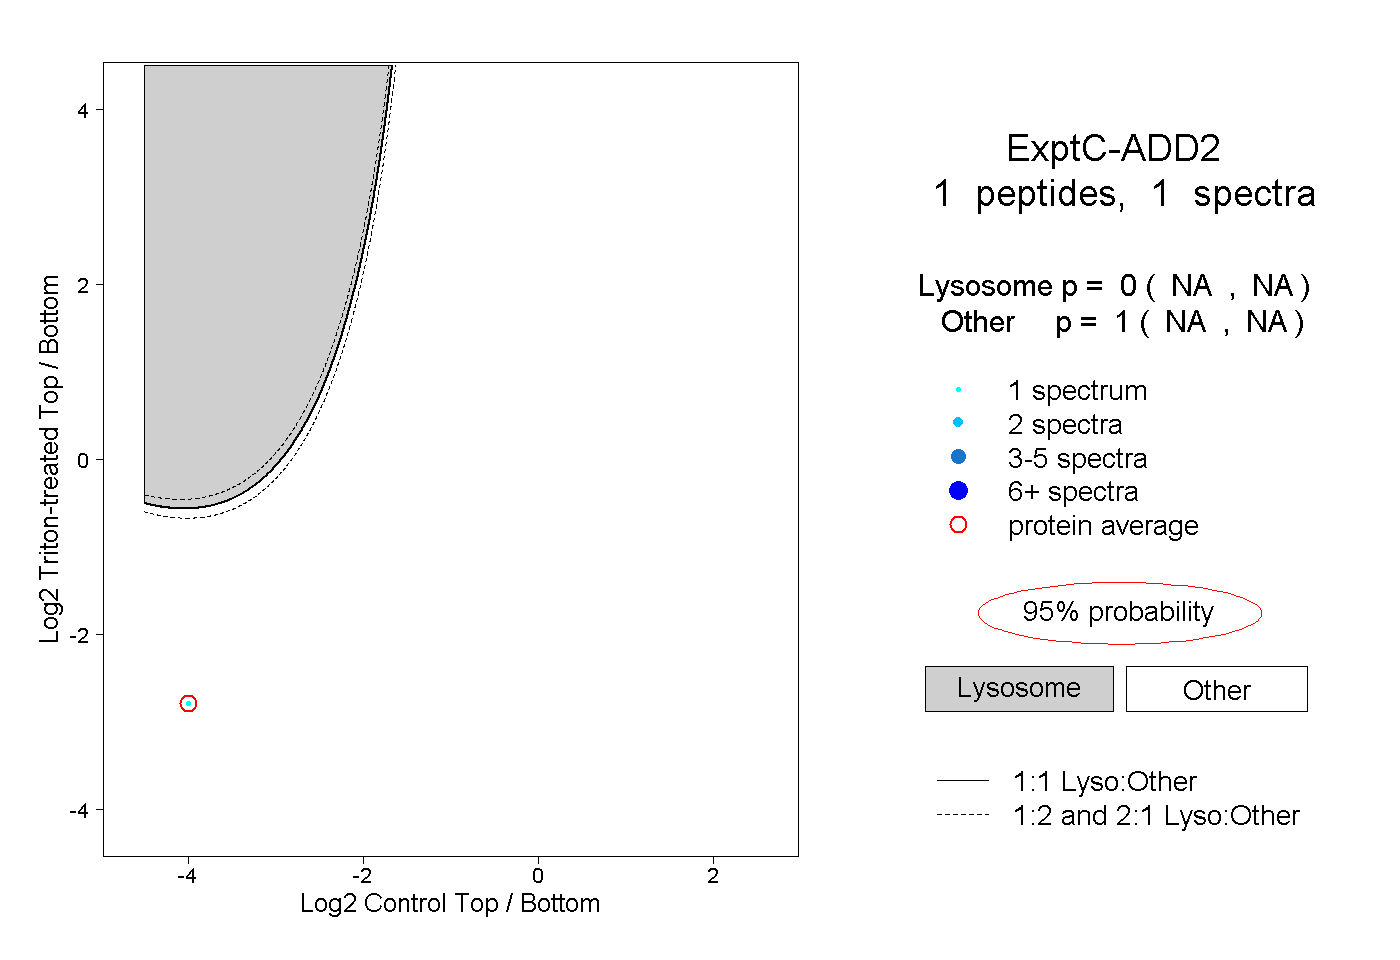
| Plot | Lyso | Other | |||||||||||
| Expt C |
1 peptide |
1 spectrum |
|
0.000 NA | NA |
1.000 NA | NA |