 5
5peptides
spectra
0.000 | 0.092
0.000 | 0.000
0.000 | 0.000
0.000 | 0.113
0.231 | 0.435
0.000 | 0.000
0.142 | 0.220
0.327 | 0.459
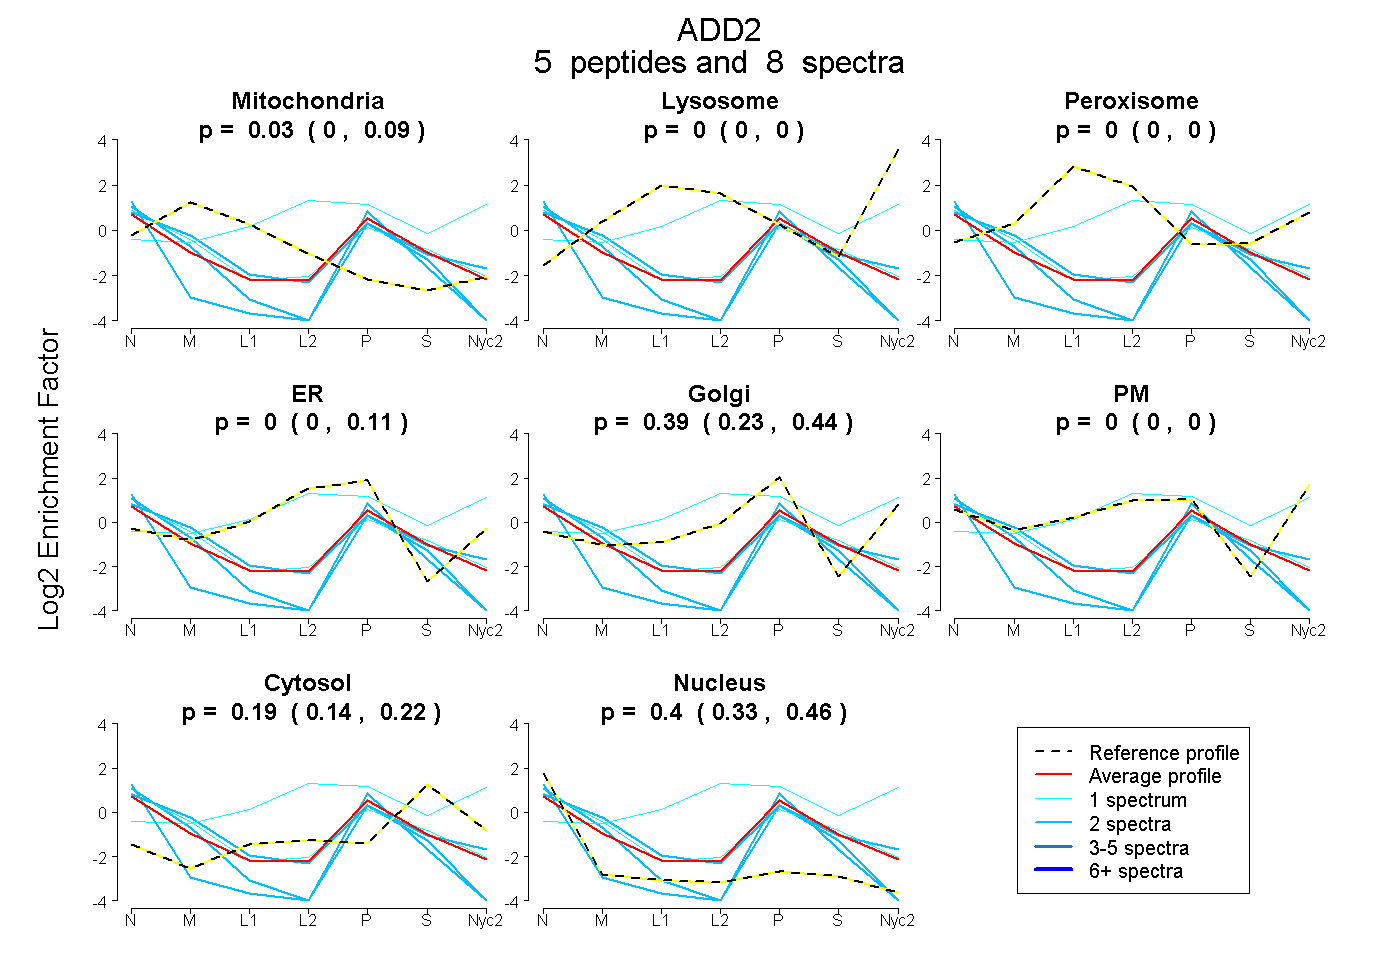
| Plot | Mito | Lyso | Perox | ER | Golgi | PM | Cytosol | Nucleus | |||||
| Expt A |
5 peptides |
8 spectra |
|
0.027 0.000 | 0.092 |
0.000 0.000 | 0.000 |
0.000 0.000 | 0.000 |
0.000 0.000 | 0.113 |
0.390 0.231 | 0.435 |
0.000 0.000 | 0.000 |
0.186 0.142 | 0.220 |
0.397 0.327 | 0.459 |
| 1 spectrum, SPAVSPSK | 0.000 | 0.314 | 0.037 | 0.320 | 0.000 | 0.097 | 0.232 | 0.000 | ||
| 2 spectra, FSEDDPEYLR | 0.037 | 0.000 | 0.000 | 0.000 | 0.184 | 0.000 | 0.066 | 0.713 | ||
| 2 spectra, LGEHEFEALMR | 0.167 | 0.000 | 0.000 | 0.000 | 0.369 | 0.000 | 0.149 | 0.314 | ||
| 2 spectra, STPASPVQSPTR | 0.000 | 0.000 | 0.000 | 0.000 | 0.182 | 0.000 | 0.018 | 0.801 | ||
| 1 spectrum, GNNSSNIWALR | 0.144 | 0.000 | 0.000 | 0.000 | 0.313 | 0.000 | 0.198 | 0.345 |
| Plot | Lyso | Other | |||||||||||
| Expt C |
1 peptide |
1 spectrum |
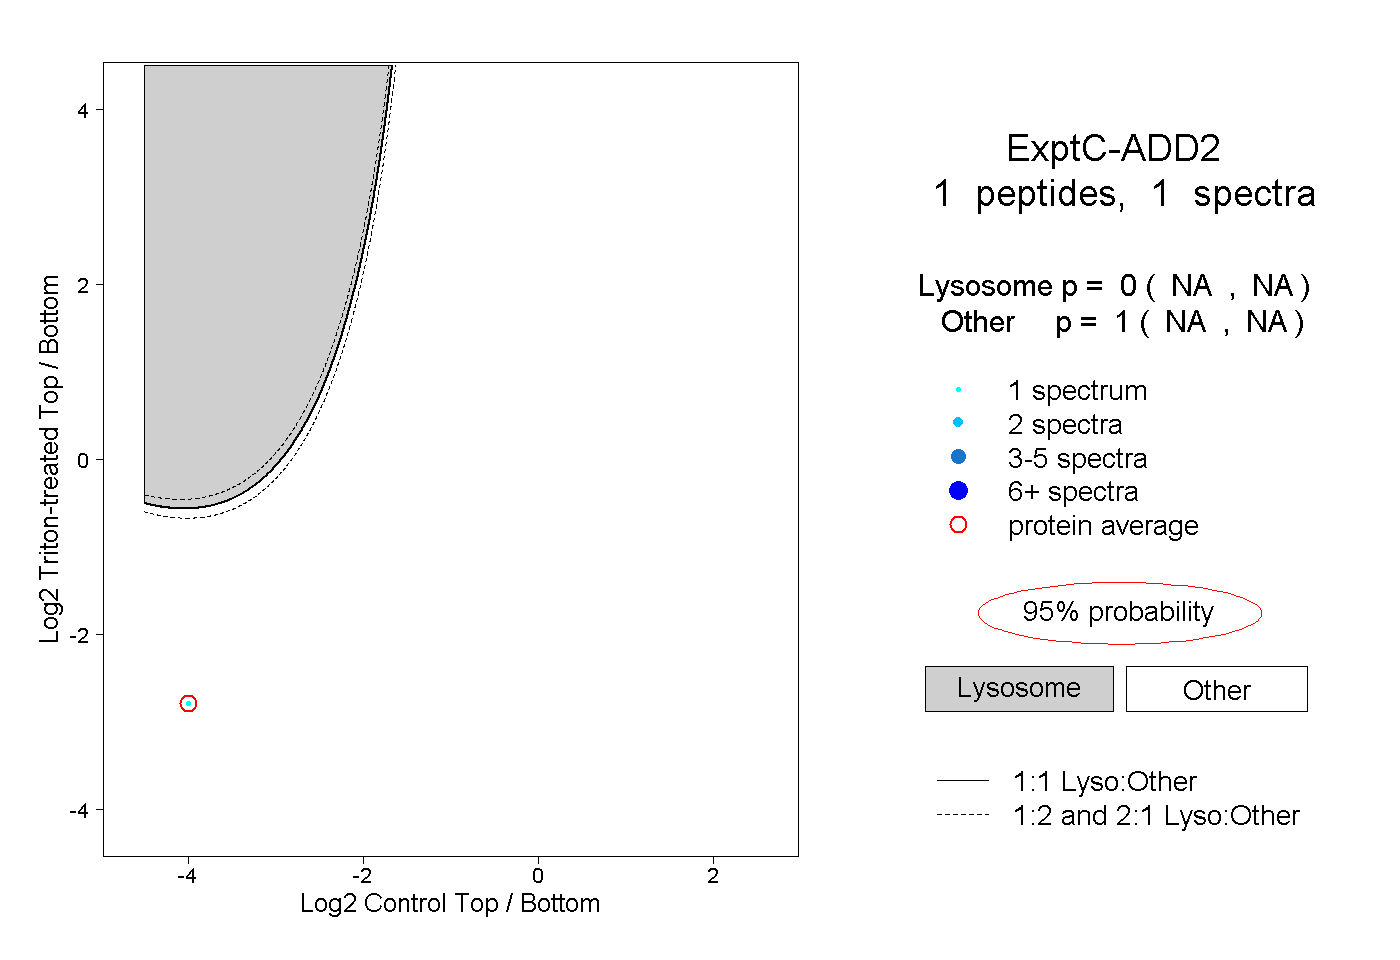 |
0.000 NA | NA |
1.000 NA | NA |