 9
9peptides
spectra
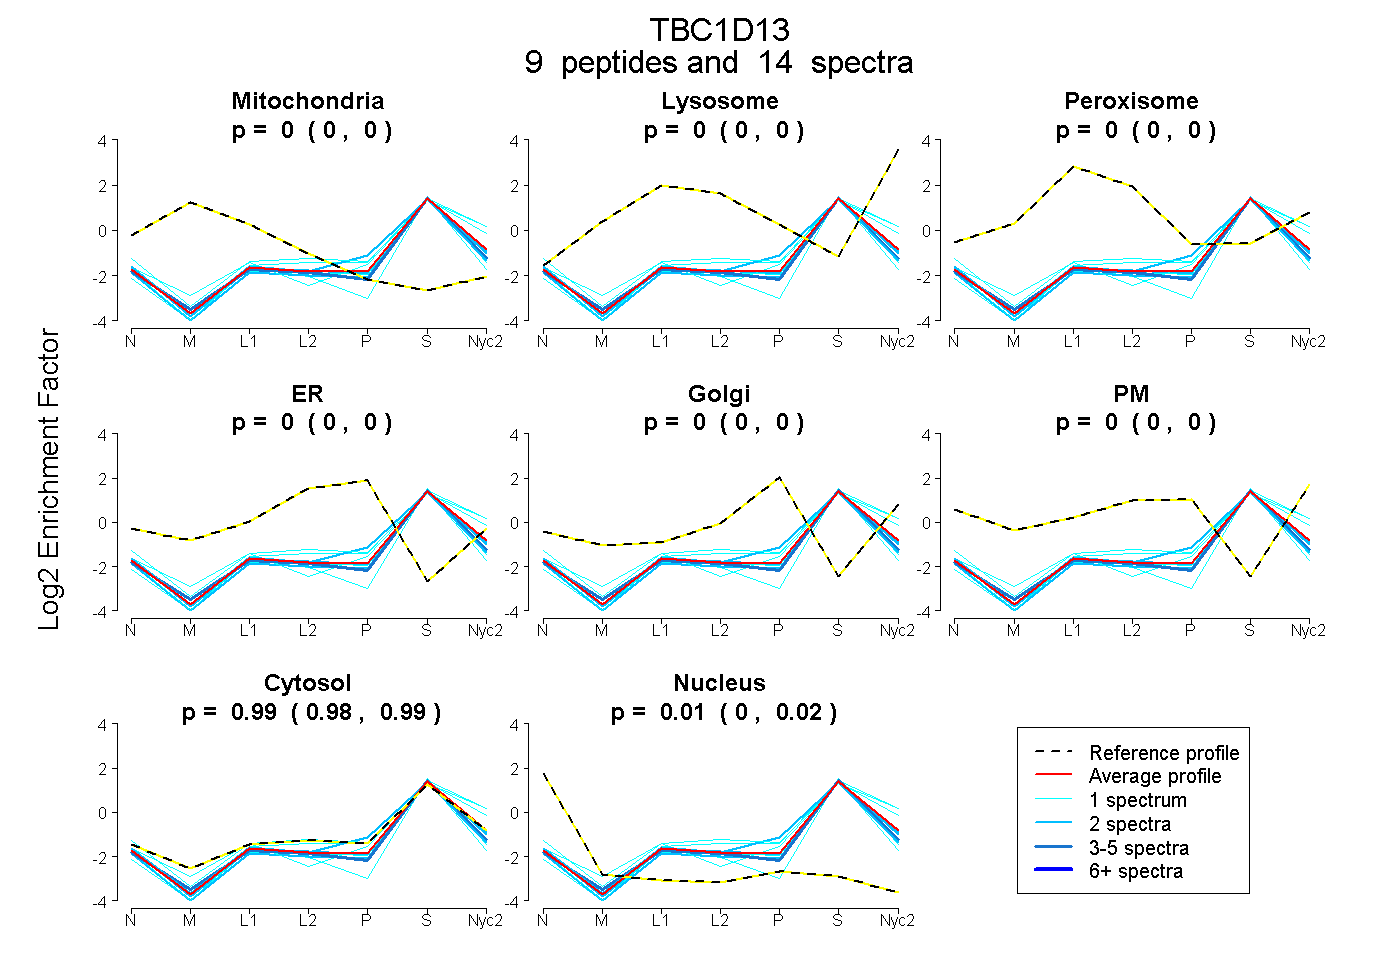
0.000 | 0.000
0.000 | 0.000
0.000 | 0.000
0.000 | 0.000
0.000 | 0.000
0.000 | 0.000
0.976 | 0.994
0.005 | 0.022
3peptides
spectra
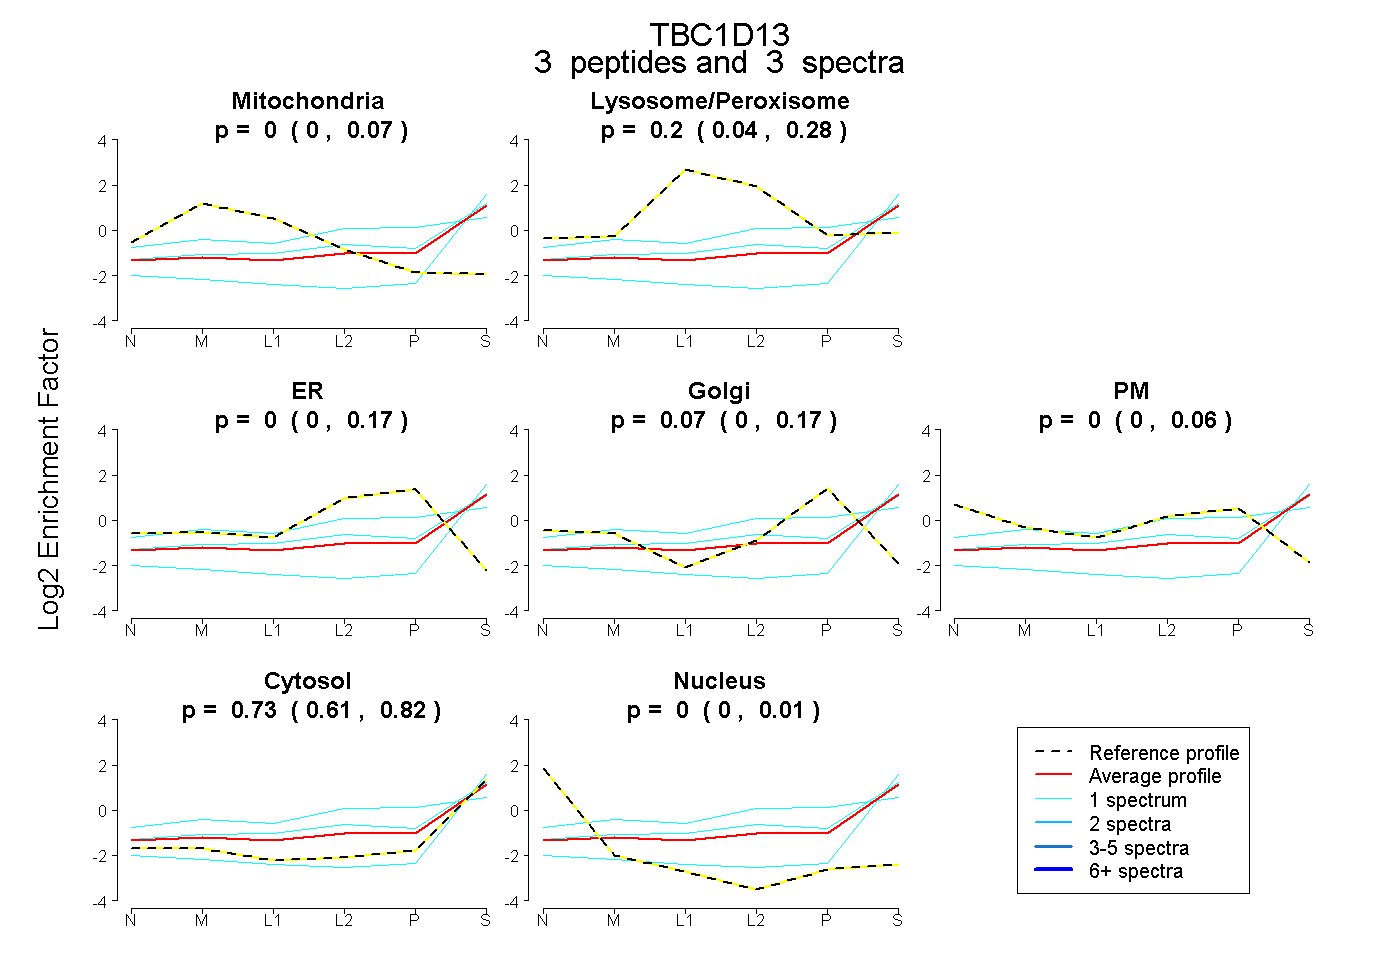
0.000 | 0.074
0.040 | 0.279
0.000 | 0.166
0.000 | 0.168
0.000 | 0.057
0.612 | 0.819
0.000 | 0.006
3peptides
spectra
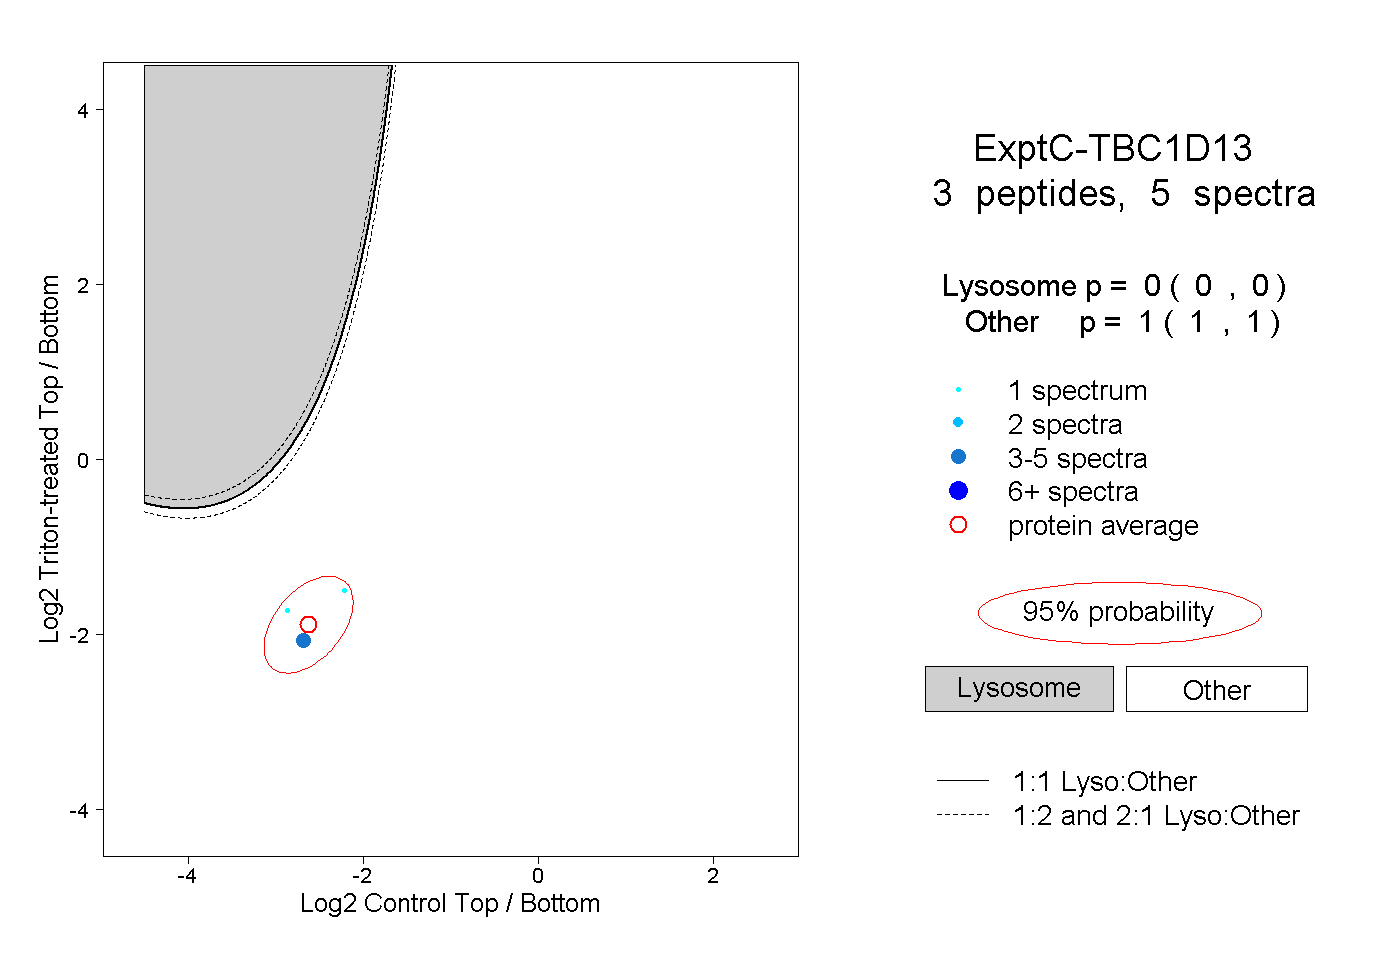
0.000 | 0.000
1.000 | 1.000