TBC1D13
[ENSRNOP00000021431]
Main page
| | | Plot |
Mito |
Lyso |
|
Perox |
ER |
Golgi |
PM |
Cytosol |
Nucleus |
|
| Expt A |
 9
9
peptides |
14
spectra |
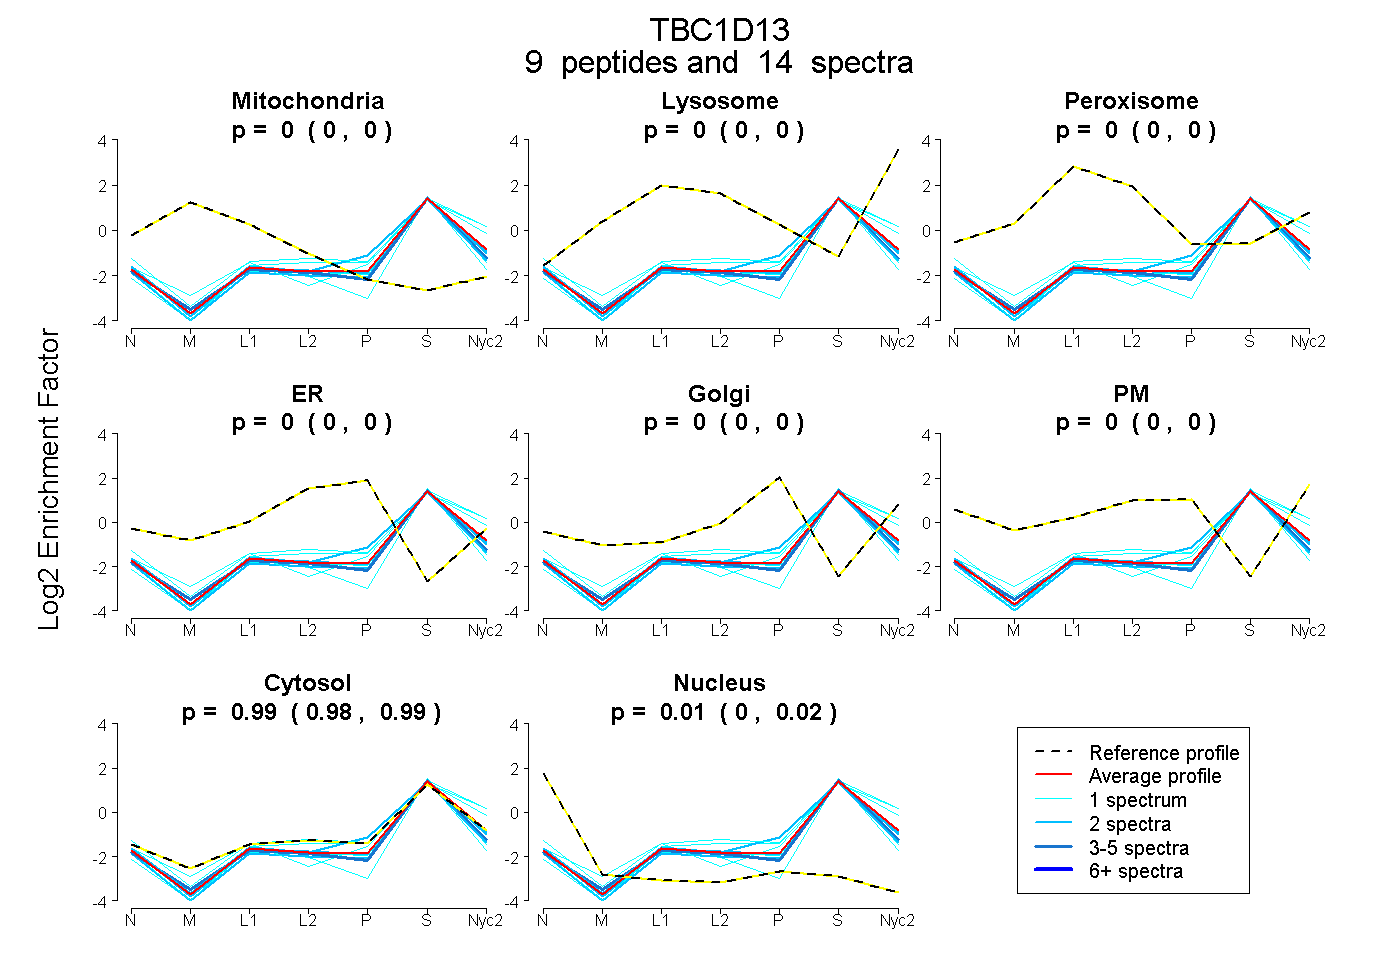 |
0.000
0.000 | 0.000 |
0.000
0.000 | 0.000 |
|
0.000
0.000 | 0.000 |
0.000
0.000 | 0.000 |
0.000
0.000 | 0.000 |
0.000
0.000 | 0.000 |
0.986
0.976 | 0.994 |
0.014
0.005 | 0.022 |
|
| | | Plot |
Mito |
|
Lyso or Perox |
|
ER |
Golgi |
PM |
Cytosol |
Nucleus |
|
| Expt B |
3
peptides |
3
spectra |
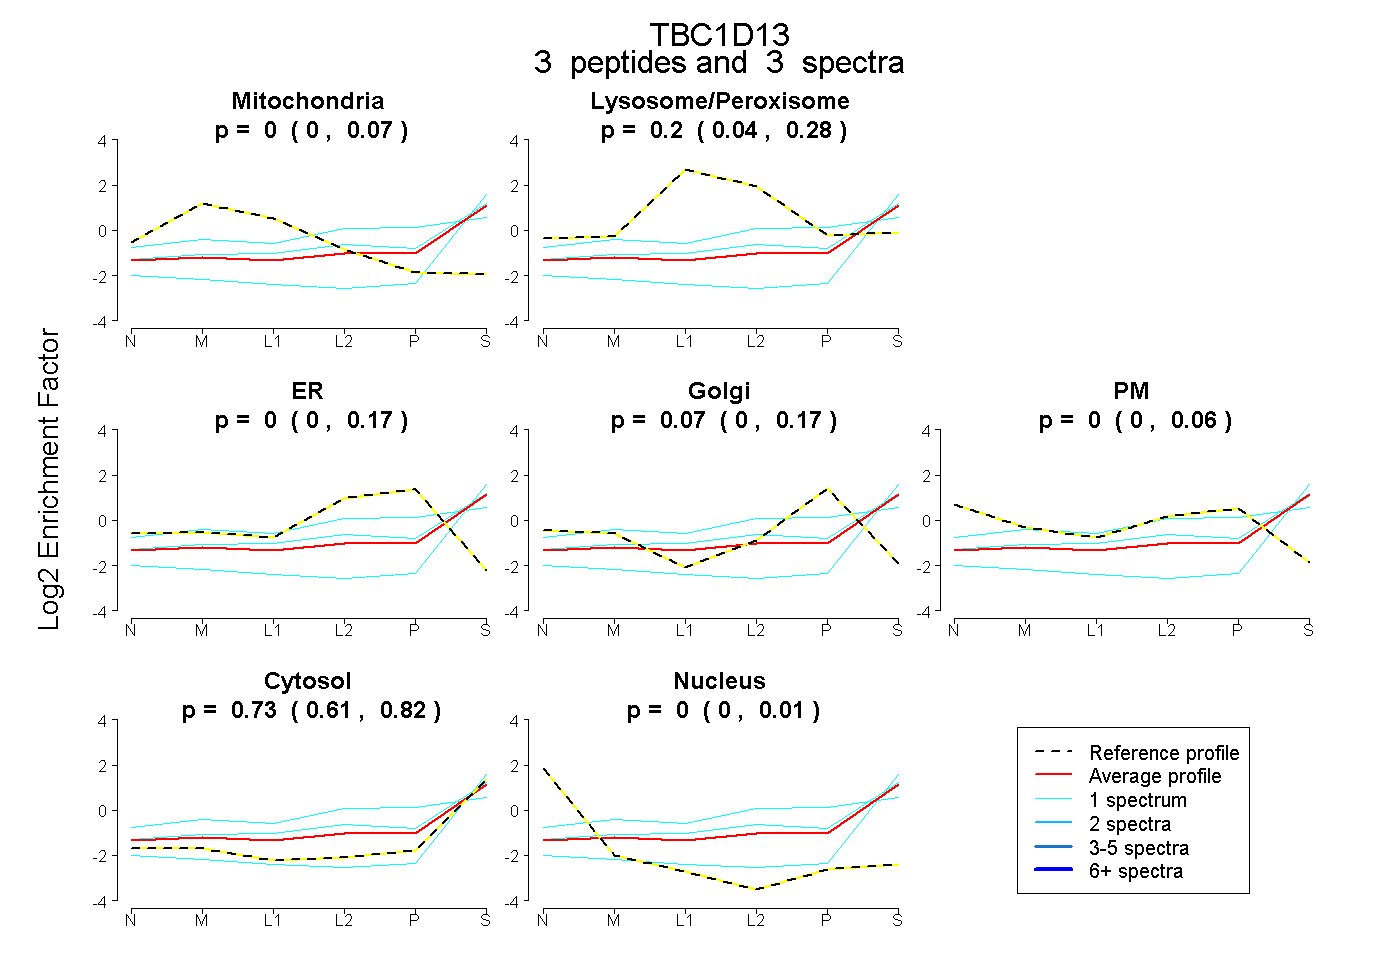 |
0.000
0.000 | 0.074 |
|
0.203
0.040 | 0.279 |
|
0.002
0.000 | 0.166 |
0.070
0.000 | 0.168 |
0.000
0.000 | 0.057 |
0.725
0.612 | 0.819 |
0.000
0.000 | 0.006 |
|
| 1 spectrum, DSWDSILAK |
0.000 |
|
0.390 |
|
0.000 |
0.271 |
0.000 |
0.339 |
0.000 |
|
| 1 spectrum, ILLNYLPLER |
0.000 |
|
0.000 |
|
0.000 |
0.000 |
0.000 |
1.000 |
0.000 |
|
| 1 spectrum, GLYSQFLR |
0.000 |
|
0.261 |
|
0.054 |
0.013 |
0.000 |
0.672 |
0.000 |
|
| | | Plot |
|
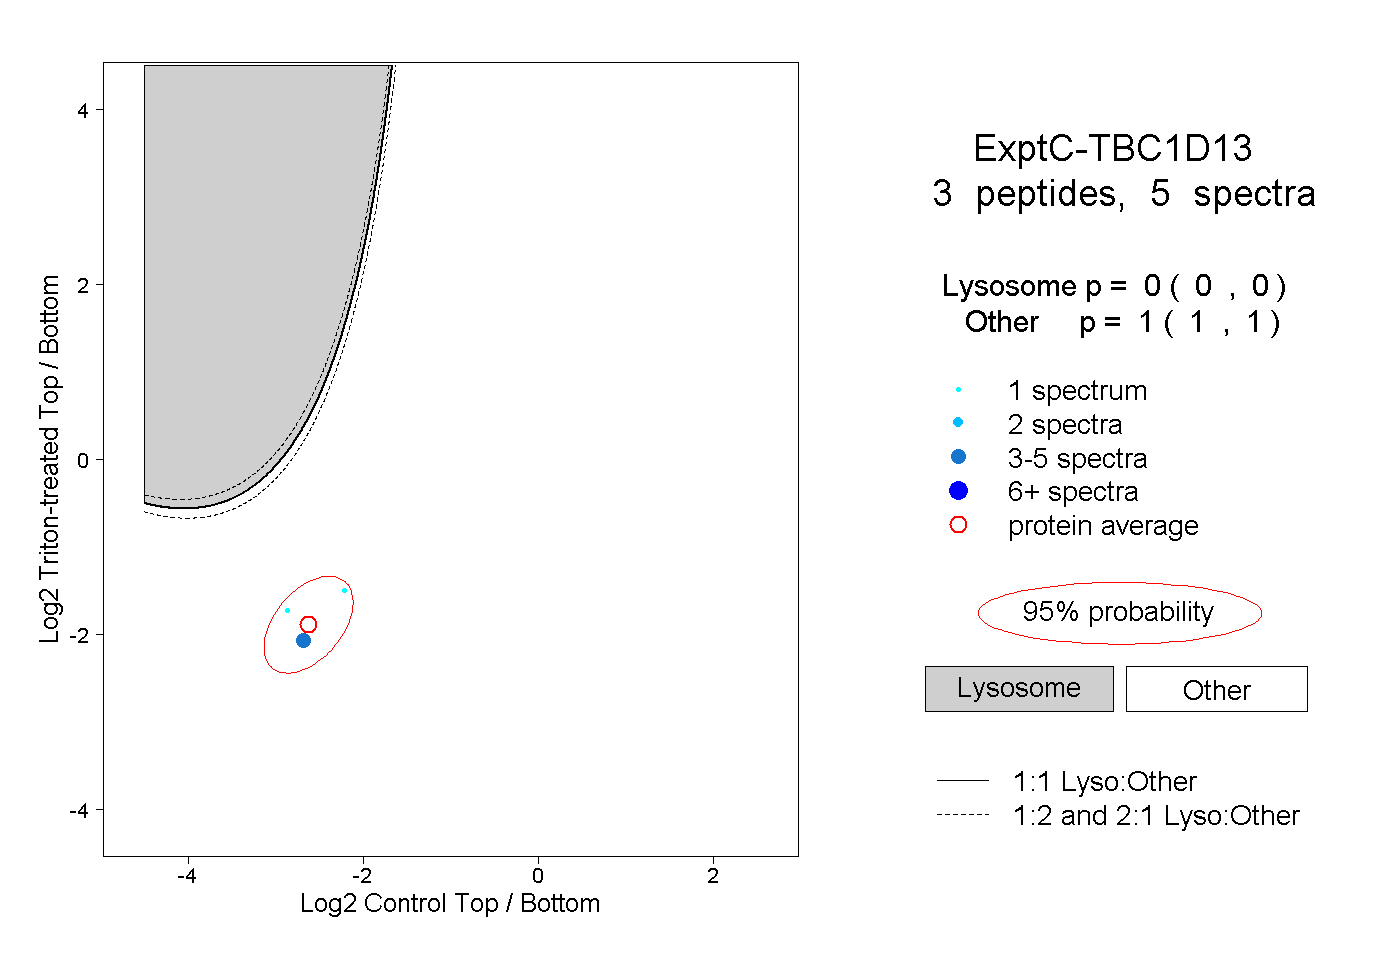
Lyso |
|
|
|
|
|
|
|
Other |
| Expt C |
3
peptides |
5
spectra |
 |
|
0.000
0.000 | 0.000 |
|
|
|
|
|
|
|
1.000
1.000 | 1.000 |