 35
35peptides
spectra
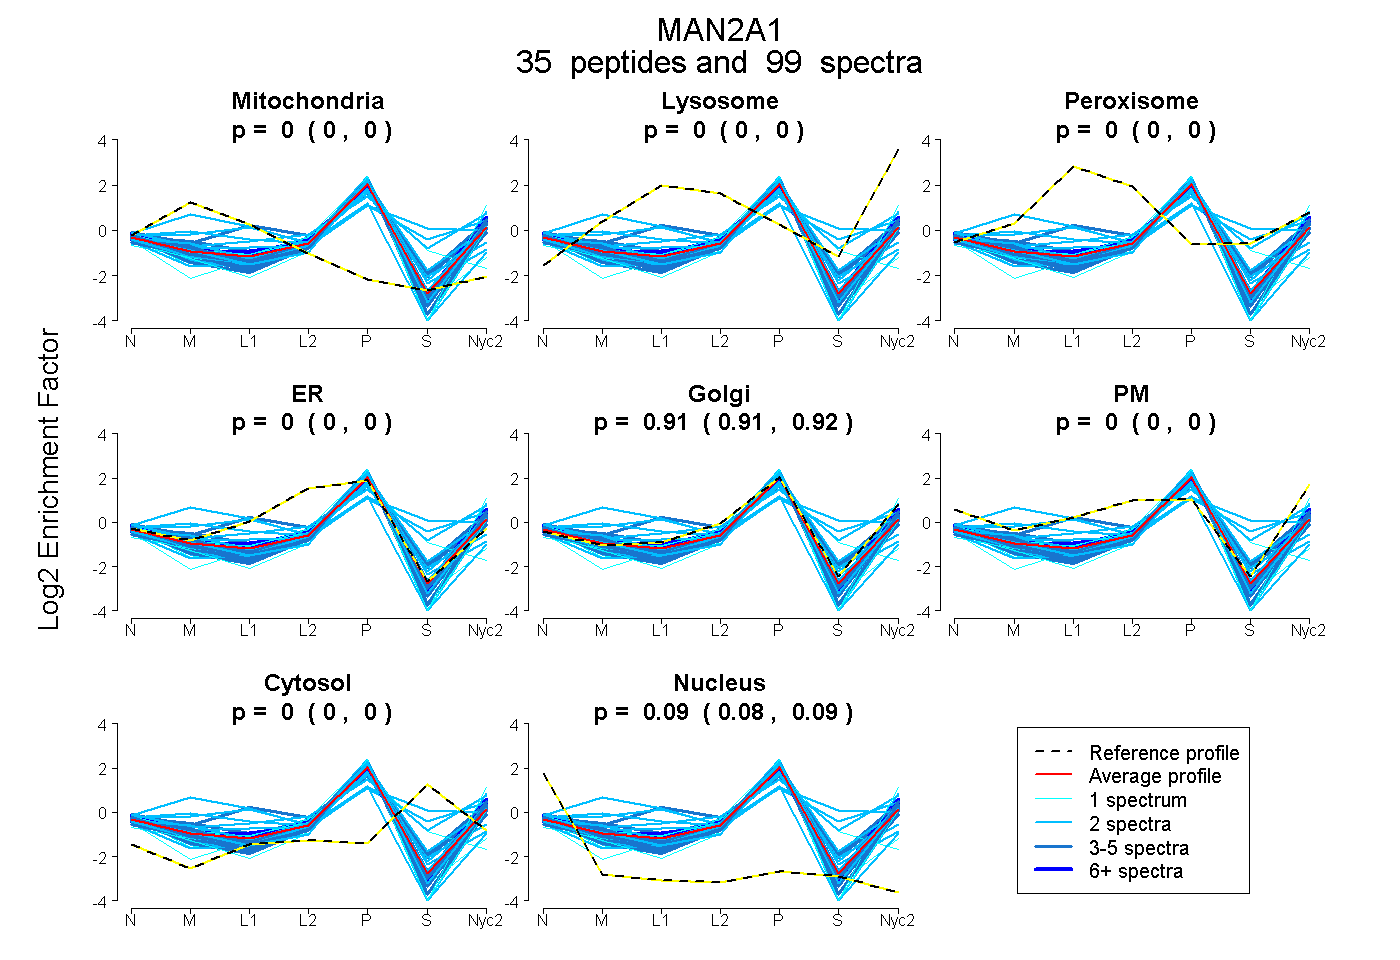
0.000 | 0.003
0.000 | 0.000
0.000 | 0.000
0.000 | 0.000
0.912 | 0.916
0.000 | 0.000
0.000 | 0.000
0.083 | 0.087
17peptides
spectra
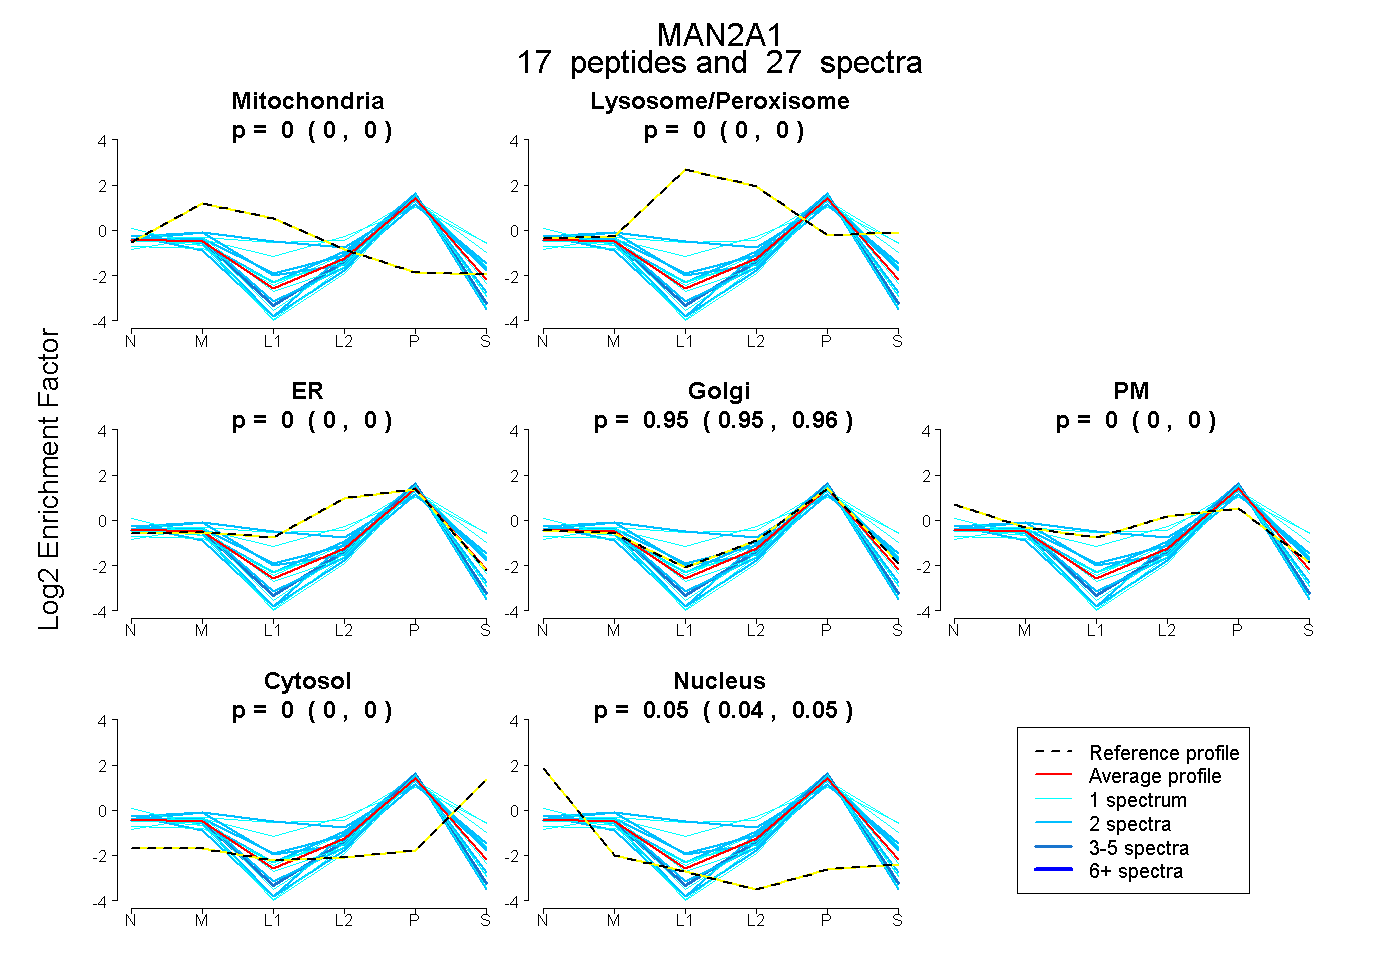
0.000 | 0.000
0.000 | 0.000
0.000 | 0.000
0.950 | 0.959
0.000 | 0.000
0.000 | 0.000
0.041 | 0.049
34peptides
spectra
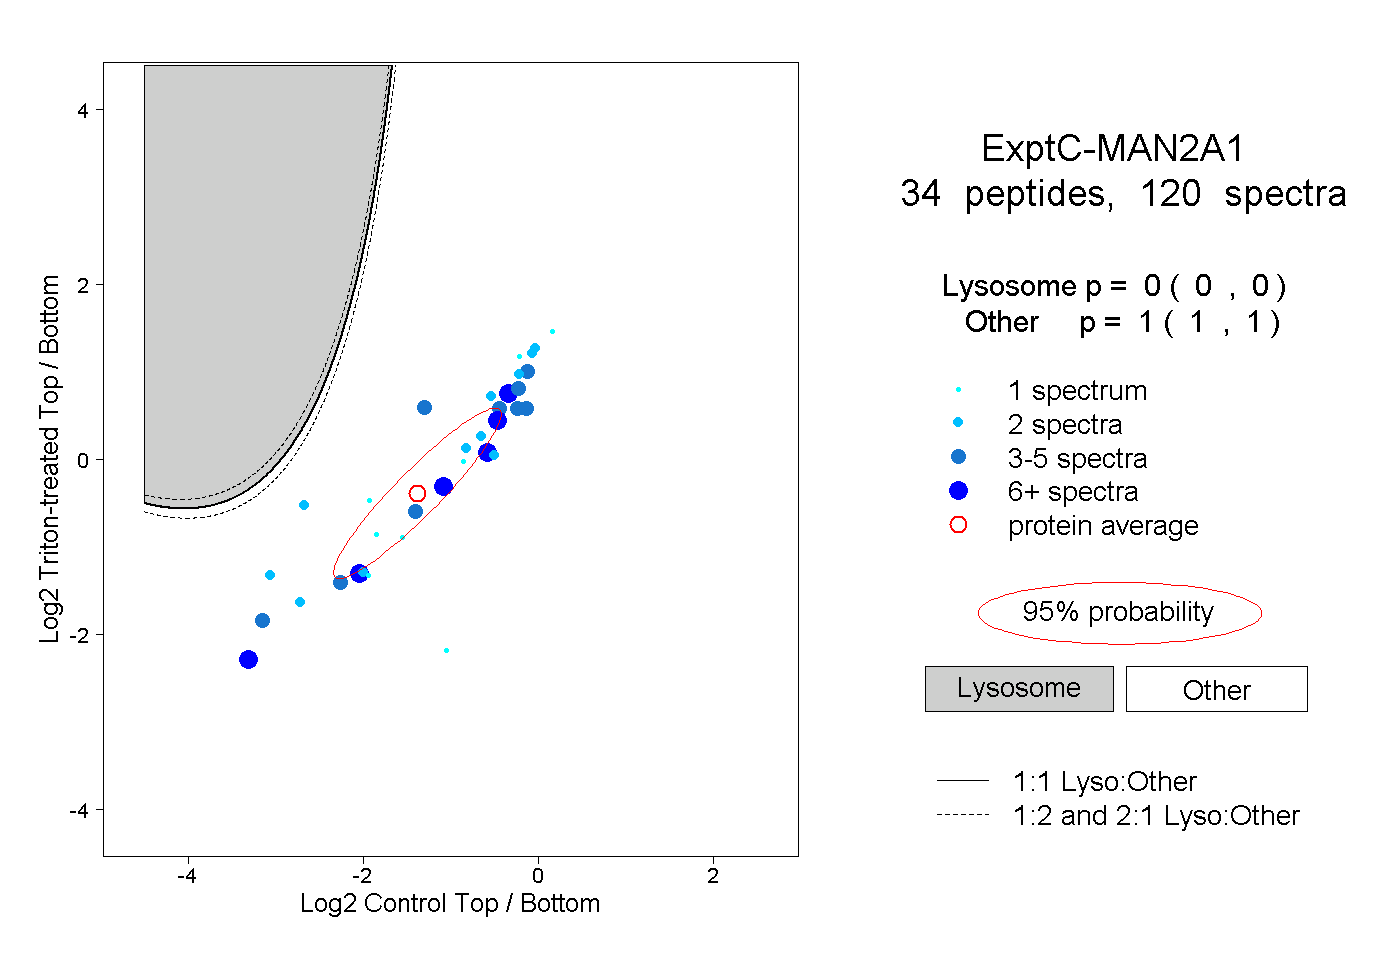
0.000 | 0.000
1.000 | 1.000
5peptides
spectra
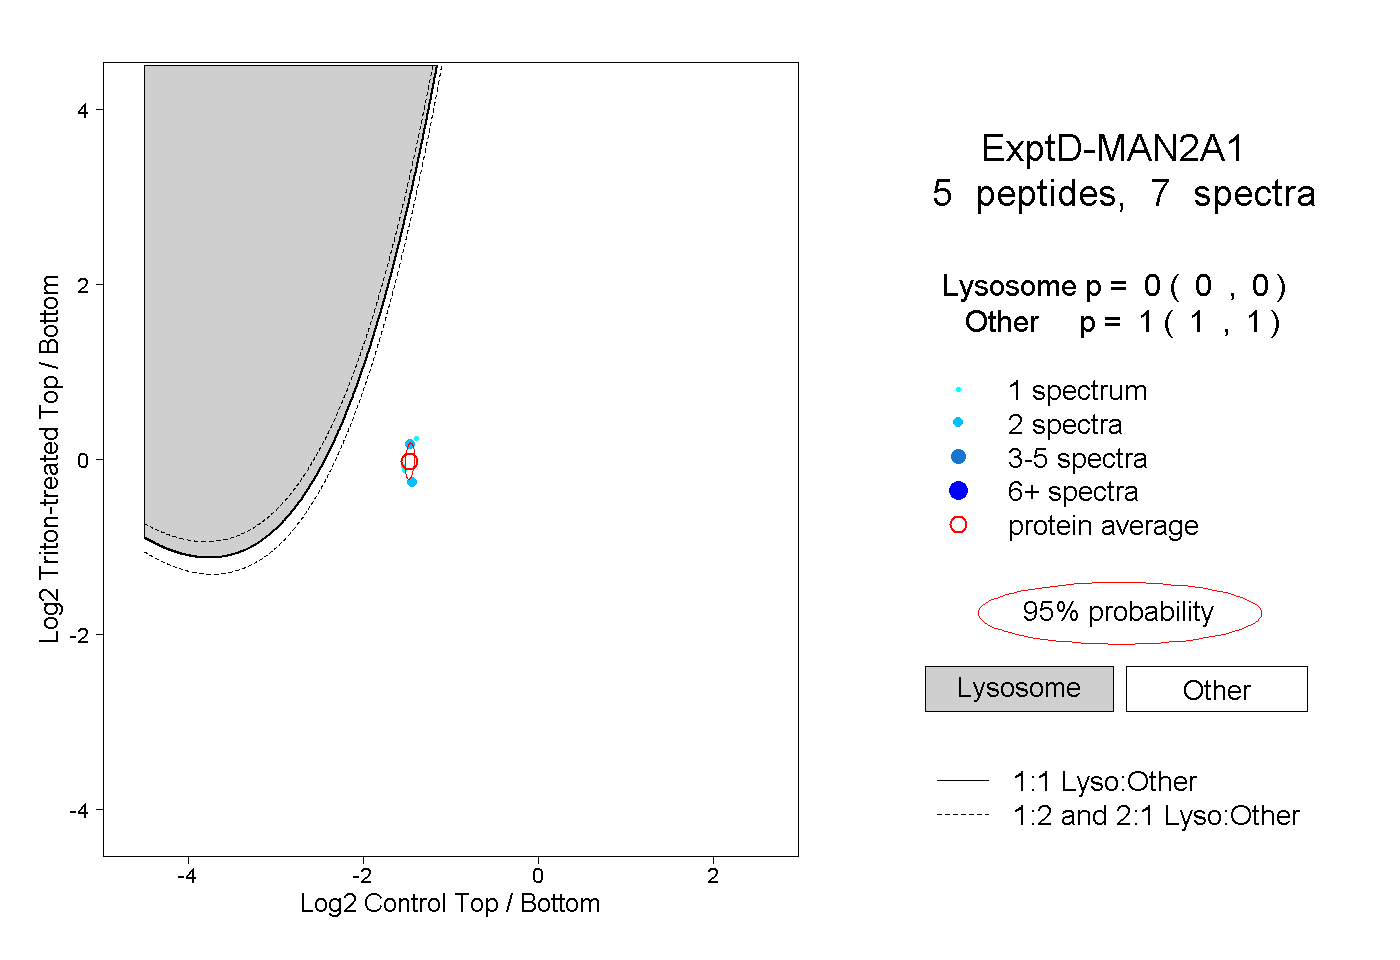
0.000 | 0.000
1.000 | 1.000