 6
6peptides
spectra
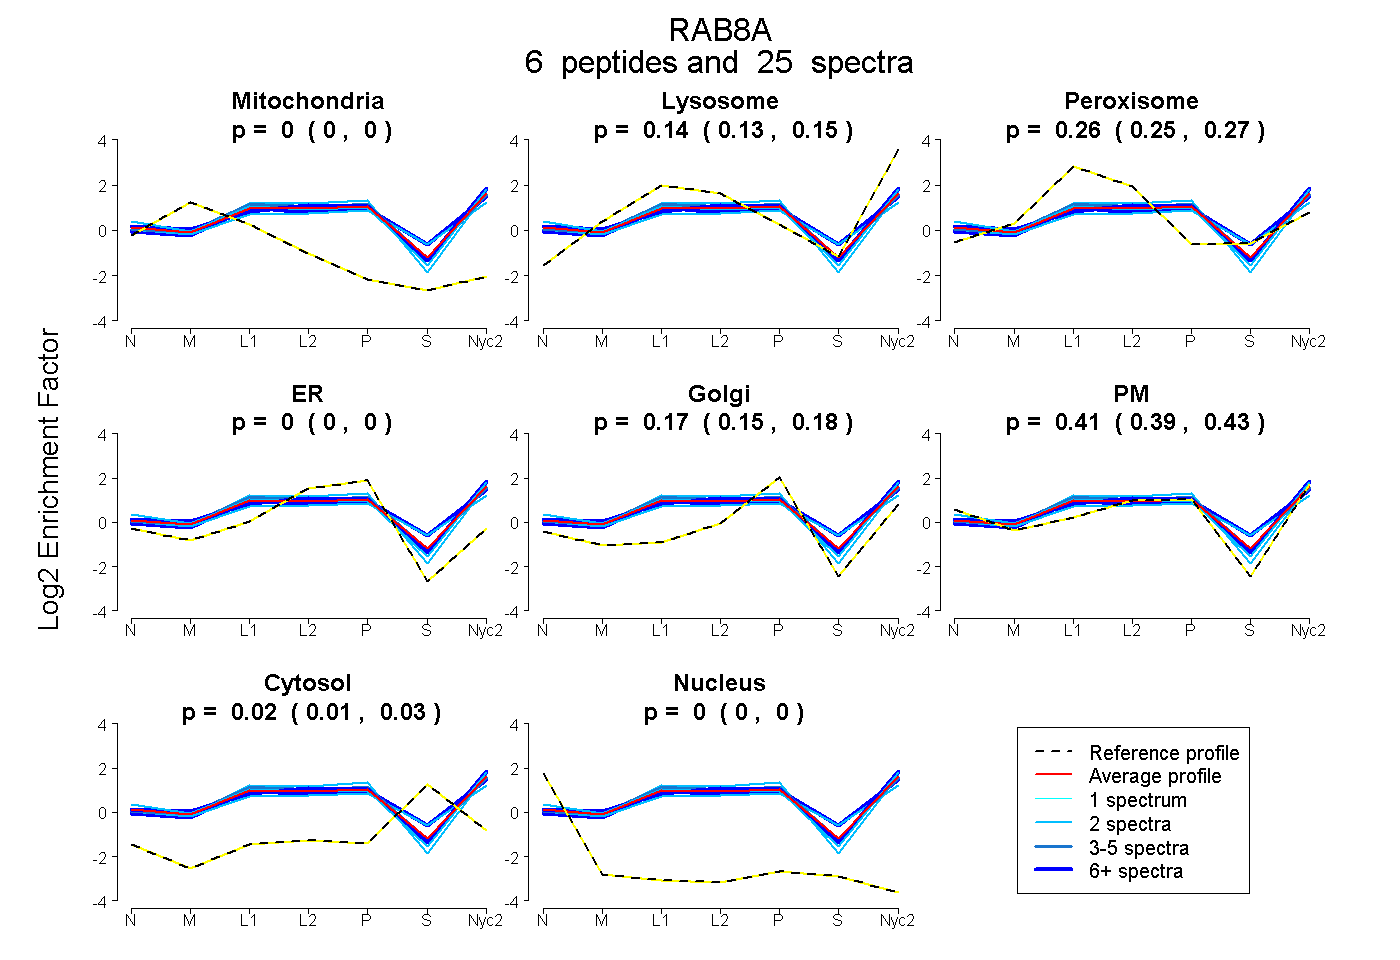
0.000 | 0.000
0.127 | 0.150
0.247 | 0.270
0.000 | 0.000
0.150 | 0.180
0.393 | 0.431
0.012 | 0.028
0.000 | 0.000
5peptides
spectra
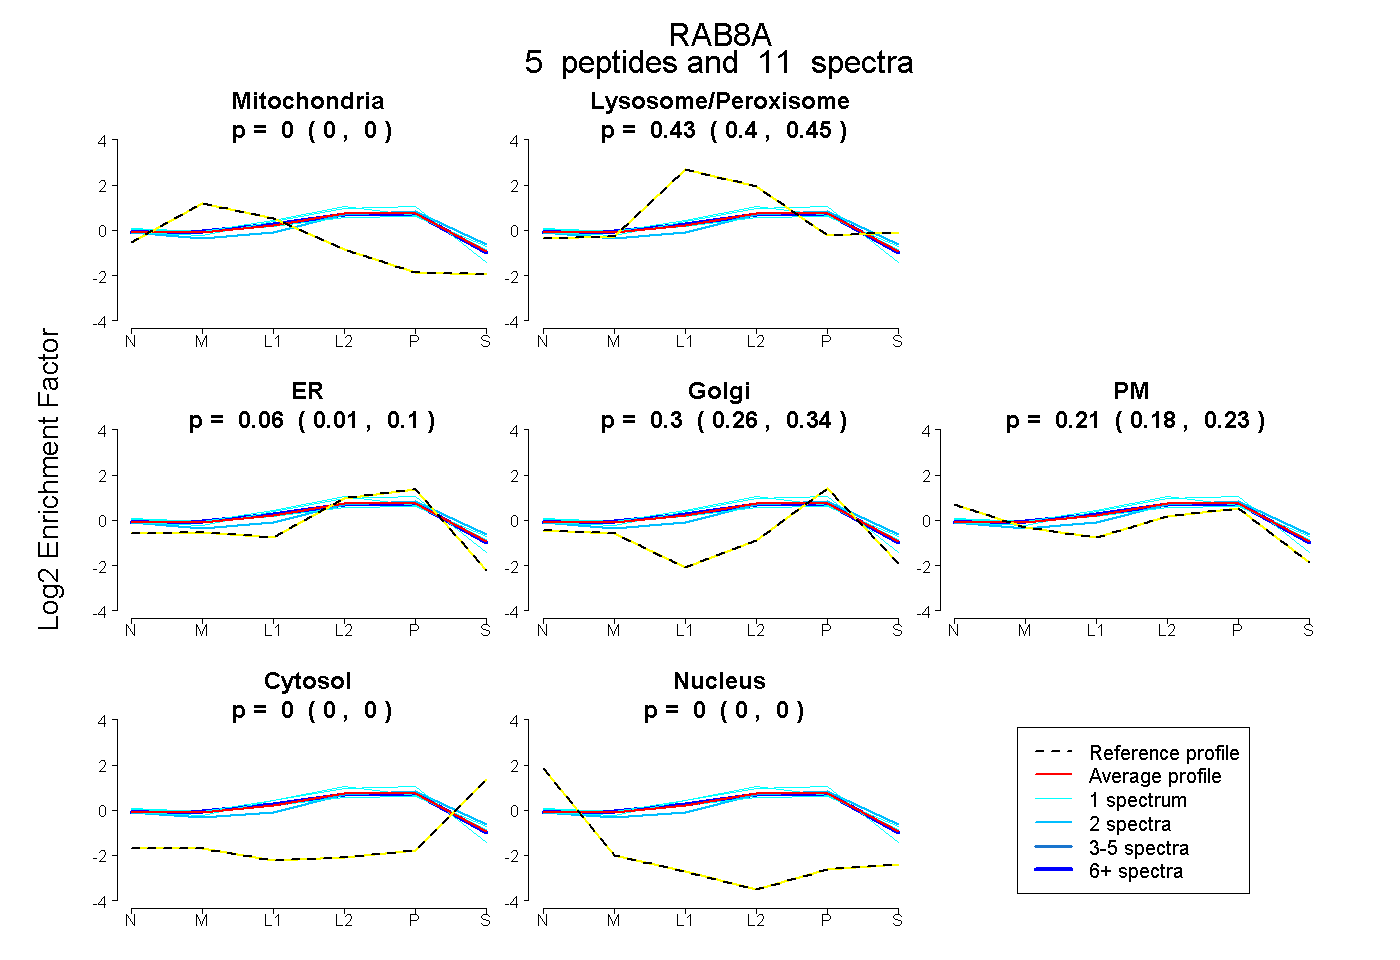
0.000 | 0.000
0.403 | 0.446
0.012 | 0.099
0.261 | 0.341
0.182 | 0.231
0.000 | 0.000
0.000 | 0.000
9peptides
spectra
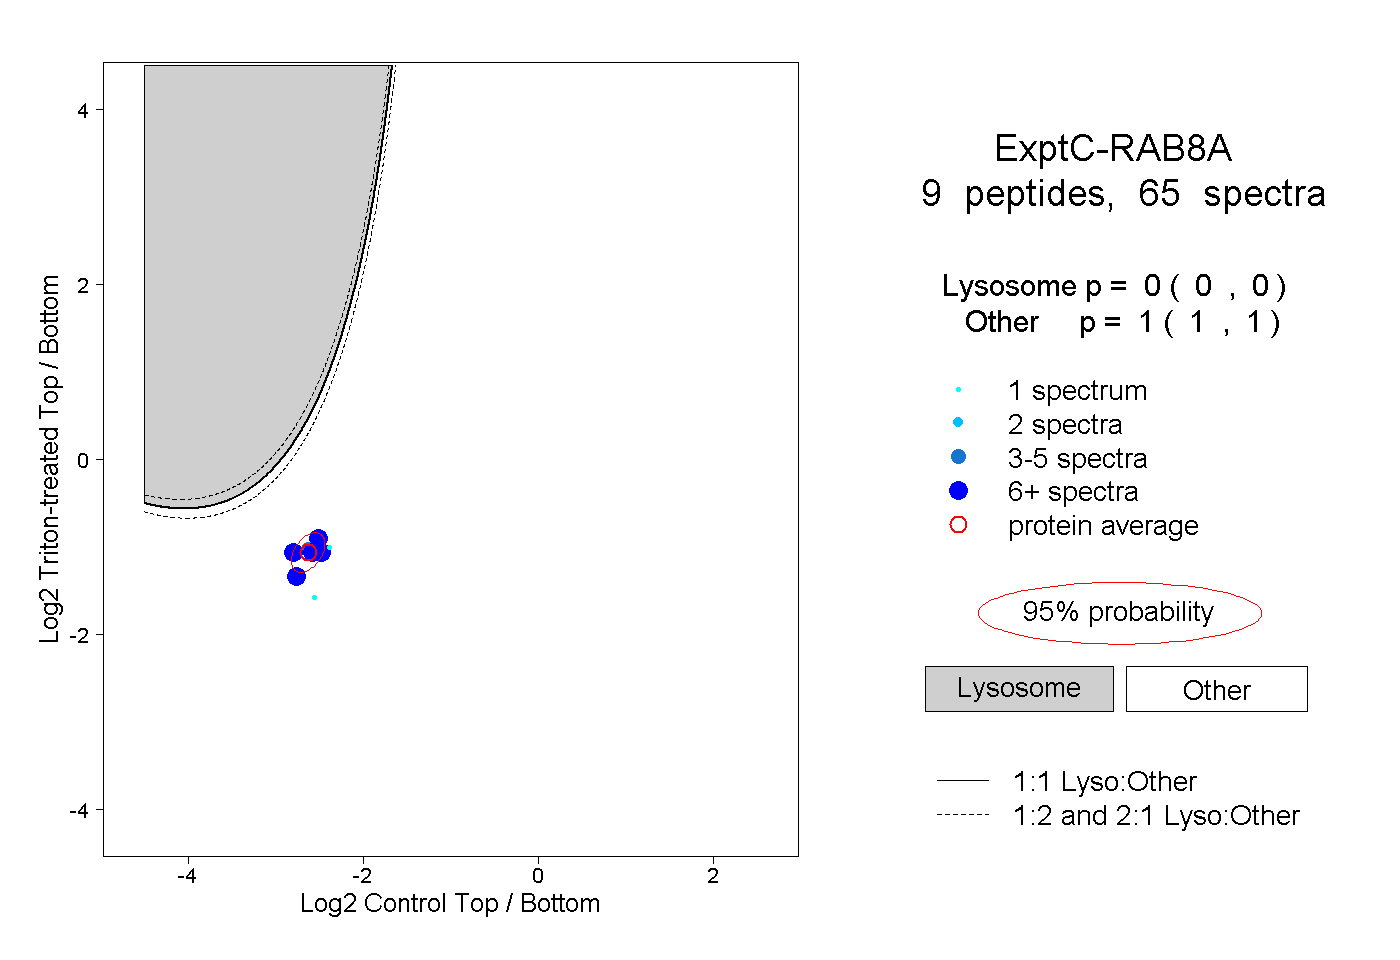
0.000 | 0.000
1.000 | 1.000
4peptides
spectra
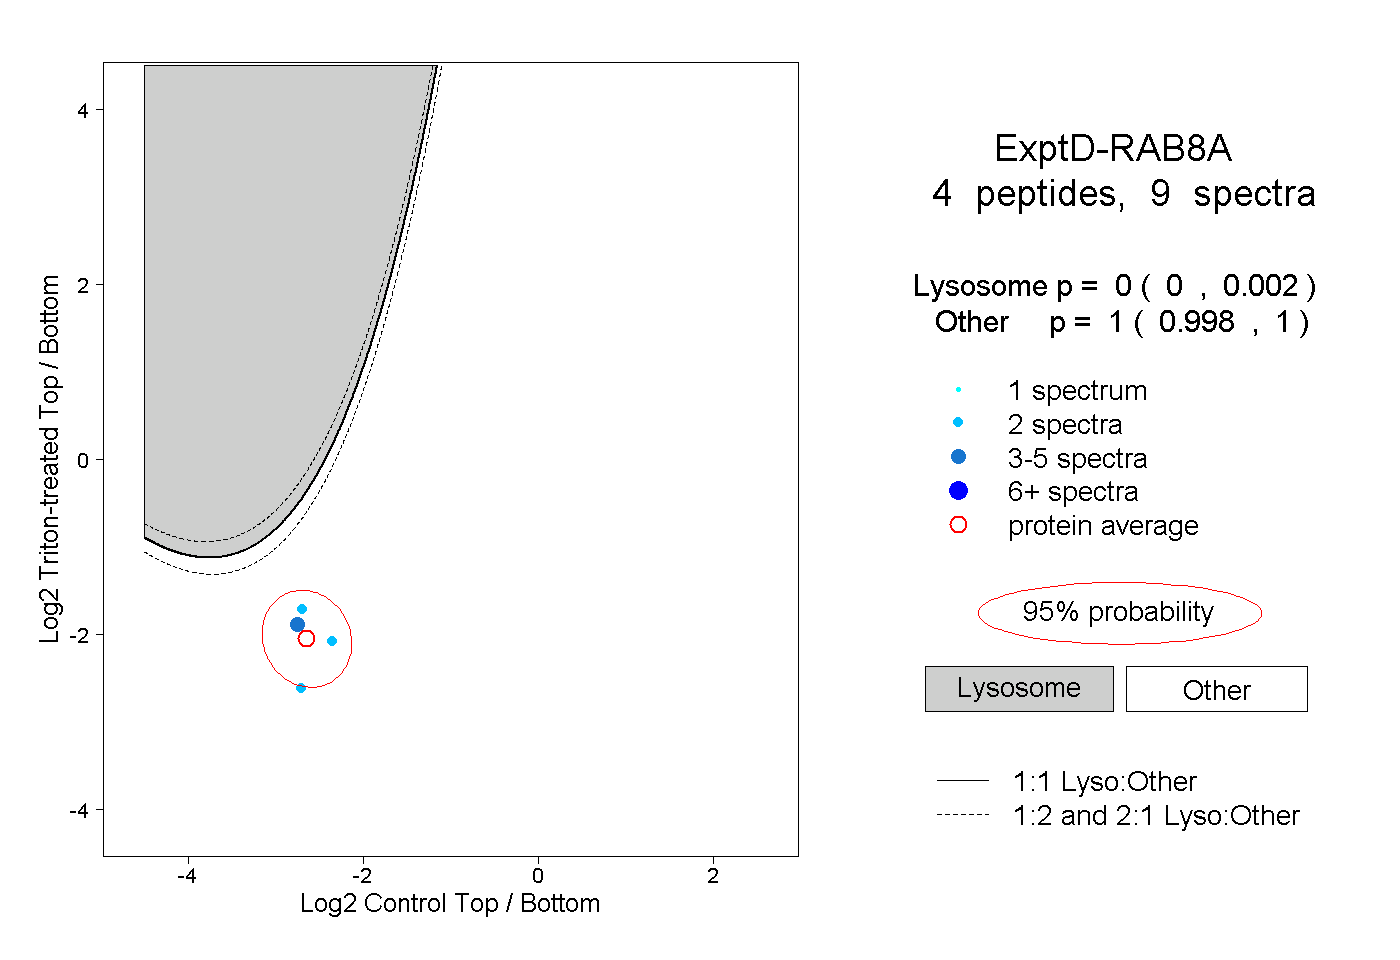
0.000 | 0.002
0.998 | 1.000