 6
6peptides
spectra
0.000 | 0.000
0.127 | 0.150
0.247 | 0.270
0.000 | 0.000
0.150 | 0.180
0.393 | 0.431
0.012 | 0.028
0.000 | 0.000
| Plot | Mito | Lyso | Perox | ER | Golgi | PM | Cytosol | Nucleus | |||||
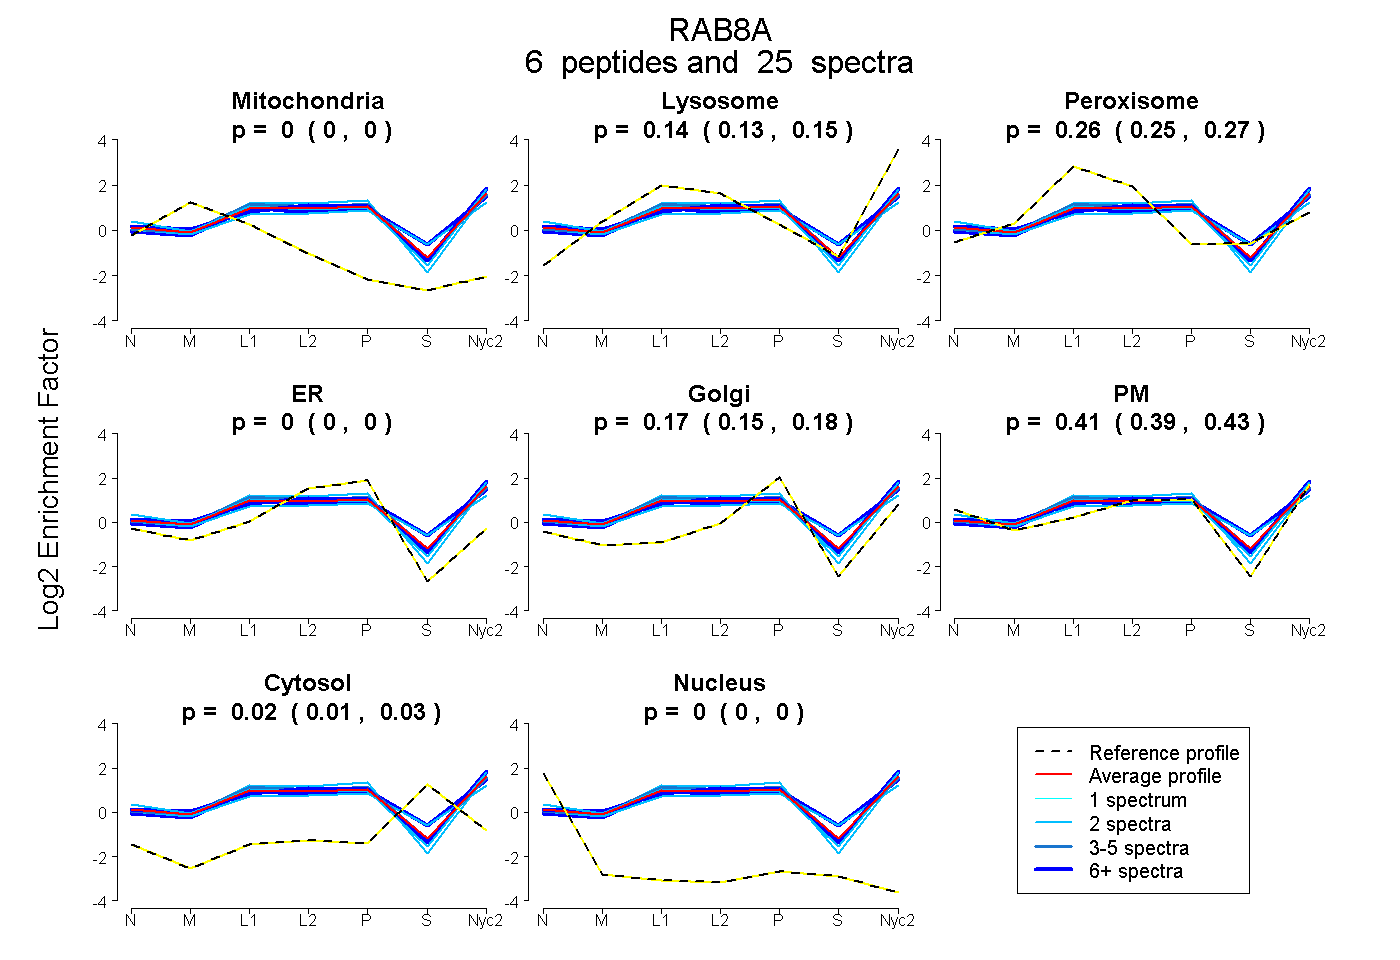
| Expt A |
6 peptides |
25 spectra |
|
0.000 0.000 | 0.000 |
0.140 0.127 | 0.150 |
0.259 0.247 | 0.270 |
0.000 0.000 | 0.000 |
0.166 0.150 | 0.180 |
0.415 0.393 | 0.431 |
0.021 0.012 | 0.028 |
0.000 0.000 | 0.000 |
| 9 spectra, GAMGIMLVYDITNEK | 0.000 | 0.176 | 0.285 | 0.000 | 0.186 | 0.260 | 0.094 | 0.000 | ||
| 6 spectra, TITTAYYR | 0.000 | 0.188 | 0.170 | 0.000 | 0.083 | 0.548 | 0.011 | 0.000 | ||
| 4 spectra, SFDNIR | 0.000 | 0.145 | 0.300 | 0.000 | 0.213 | 0.342 | 0.000 | 0.000 | ||
| 2 spectra, LAIDYGIK | 0.000 | 0.088 | 0.287 | 0.000 | 0.155 | 0.342 | 0.128 | 0.000 | ||
| 2 spectra, TYDYLFK | 0.000 | 0.116 | 0.194 | 0.000 | 0.028 | 0.661 | 0.000 | 0.000 | ||
| 2 spectra, ANINVENAFFTLAR | 0.000 | 0.180 | 0.130 | 0.133 | 0.000 | 0.557 | 0.000 | 0.000 |
| Plot | Mito | Lyso or Perox | ER | Golgi | PM | Cytosol | Nucleus | ||||||
| Expt B |
5 peptides |
11 spectra |
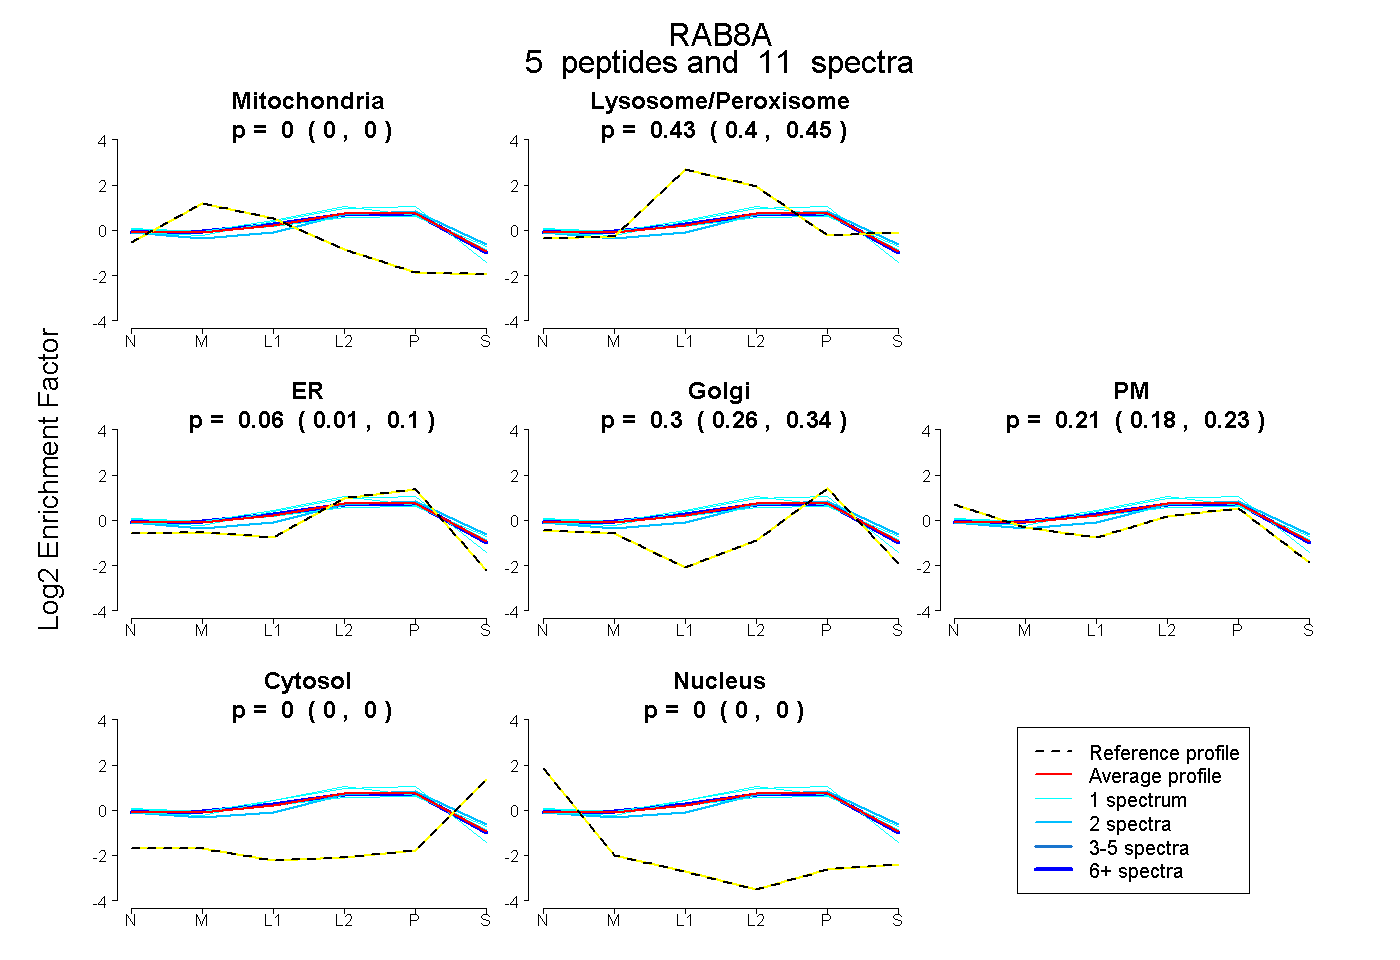 |
0.000 0.000 | 0.000 |
0.427 0.403 | 0.446 |
0.060 0.012 | 0.099 |
0.304 0.261 | 0.341 |
0.209 0.182 | 0.231 |
0.000 0.000 | 0.000 |
0.000 0.000 | 0.000 |
|||
| Plot | Lyso | Other | |||||||||||
| Expt C |
9 peptides |
65 spectra |
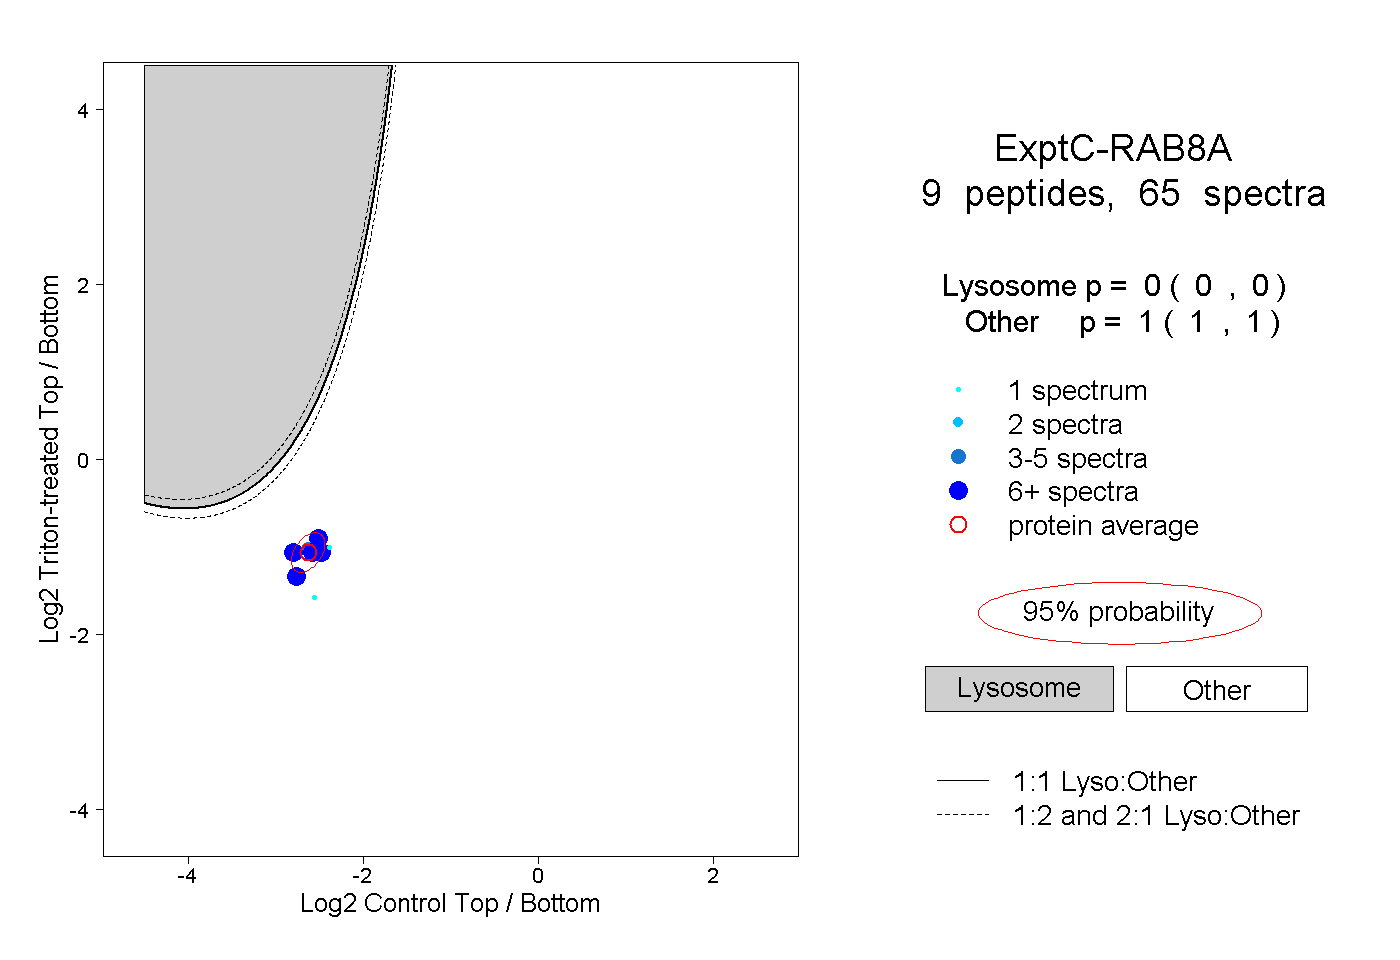 |
0.000 0.000 | 0.000 |
1.000 1.000 | 1.000 |
||||||||
| Plot | Lyso | Other | |||||||||||
| Expt D |
4 peptides |
9 spectra |
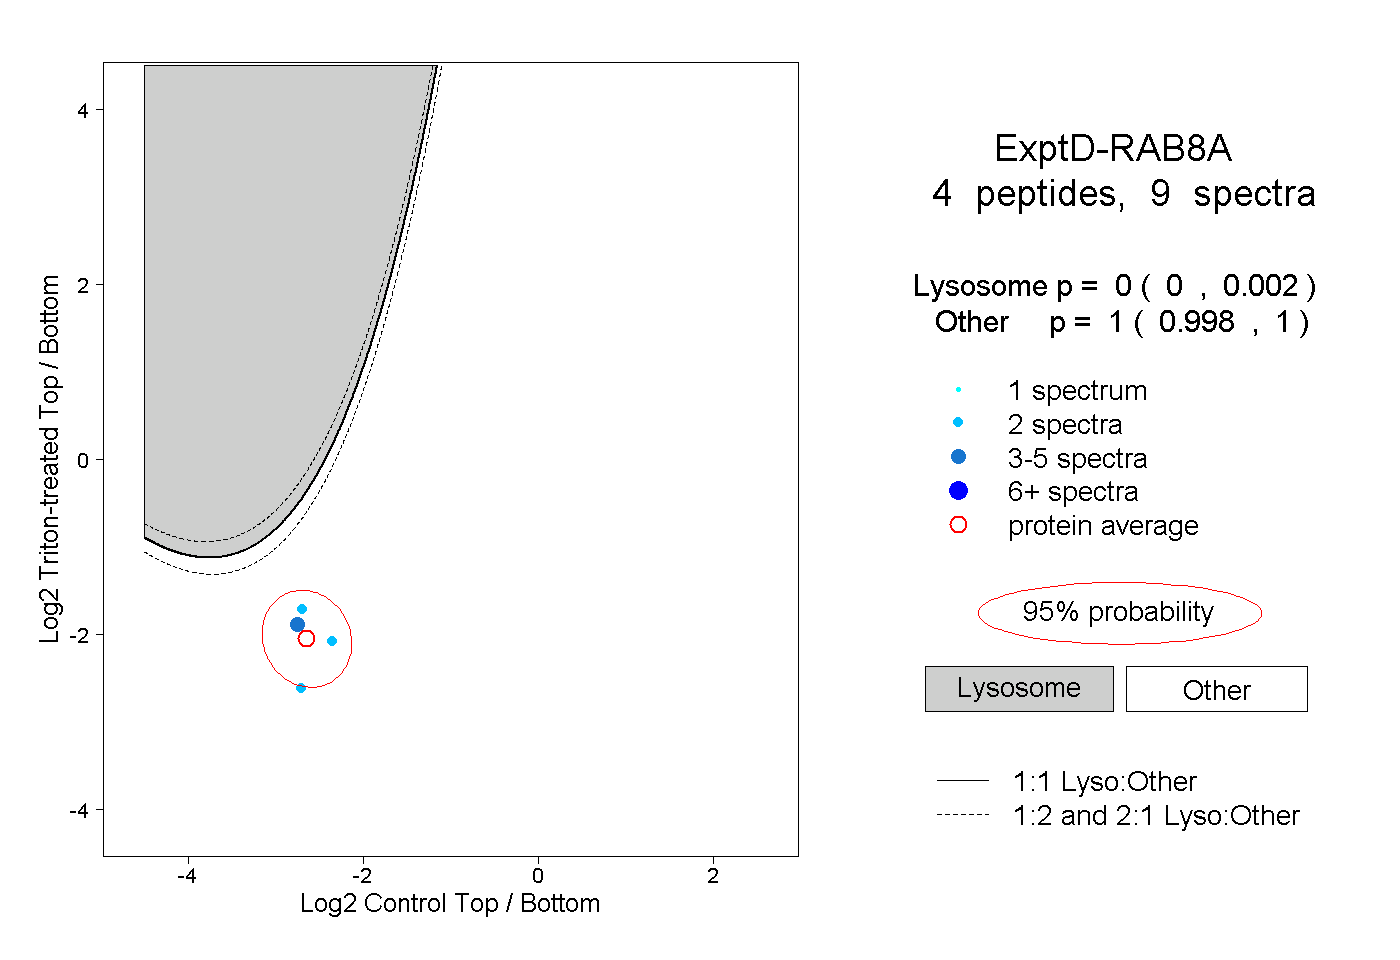 |
0.000 0.000 | 0.002 |
1.000 0.998 | 1.000 |