 5
5peptides
spectra
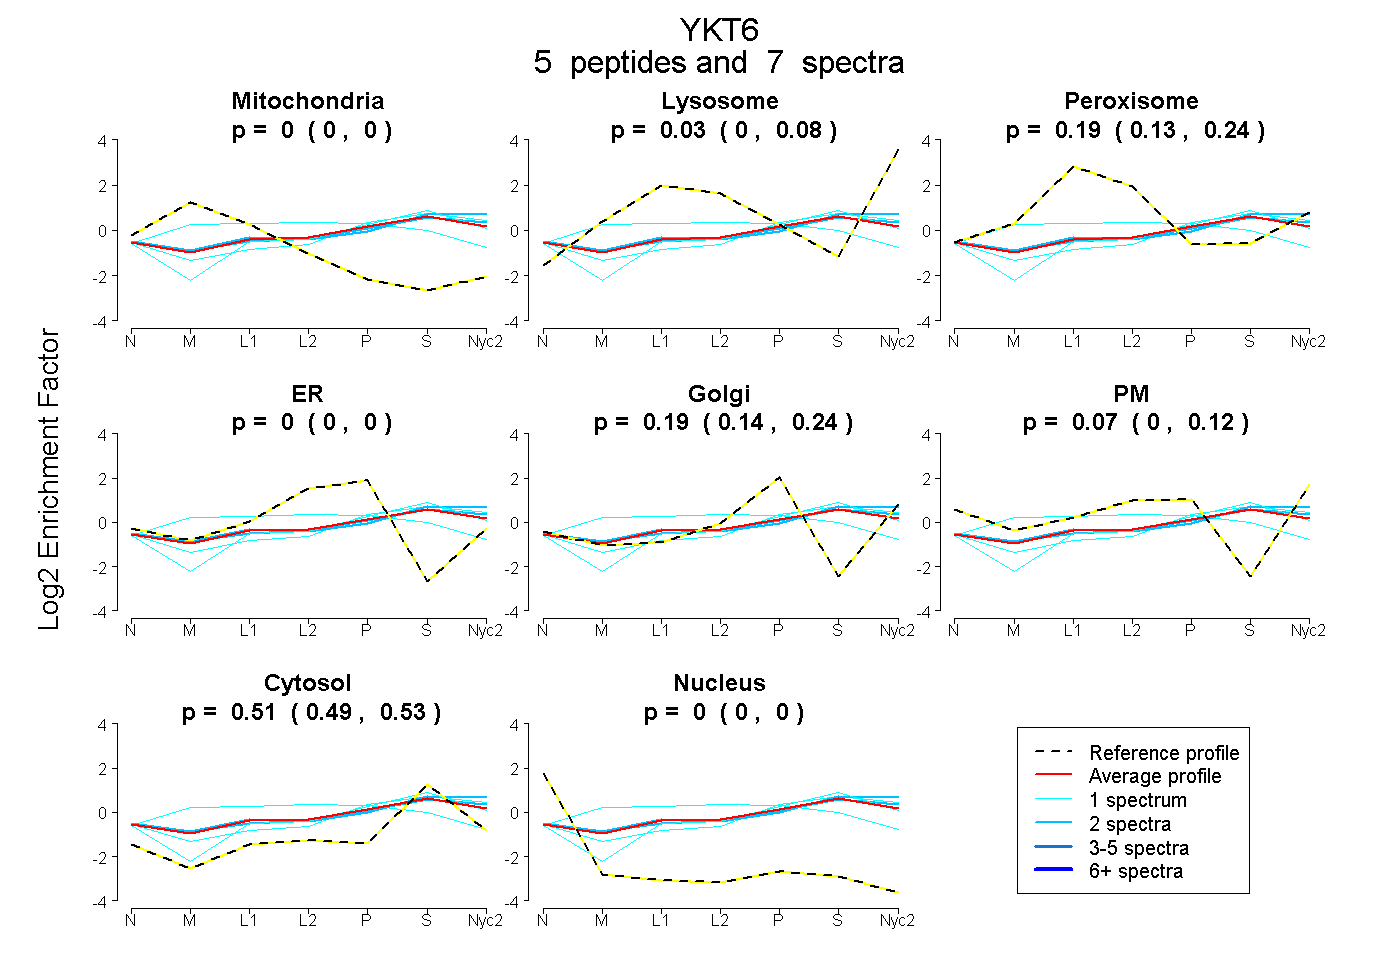
0.000 | 0.000
0.000 | 0.076
0.130 | 0.244
0.000 | 0.000
0.138 | 0.244
0.000 | 0.115
0.487 | 0.533
0.000 | 0.000
1peptide
spectrum
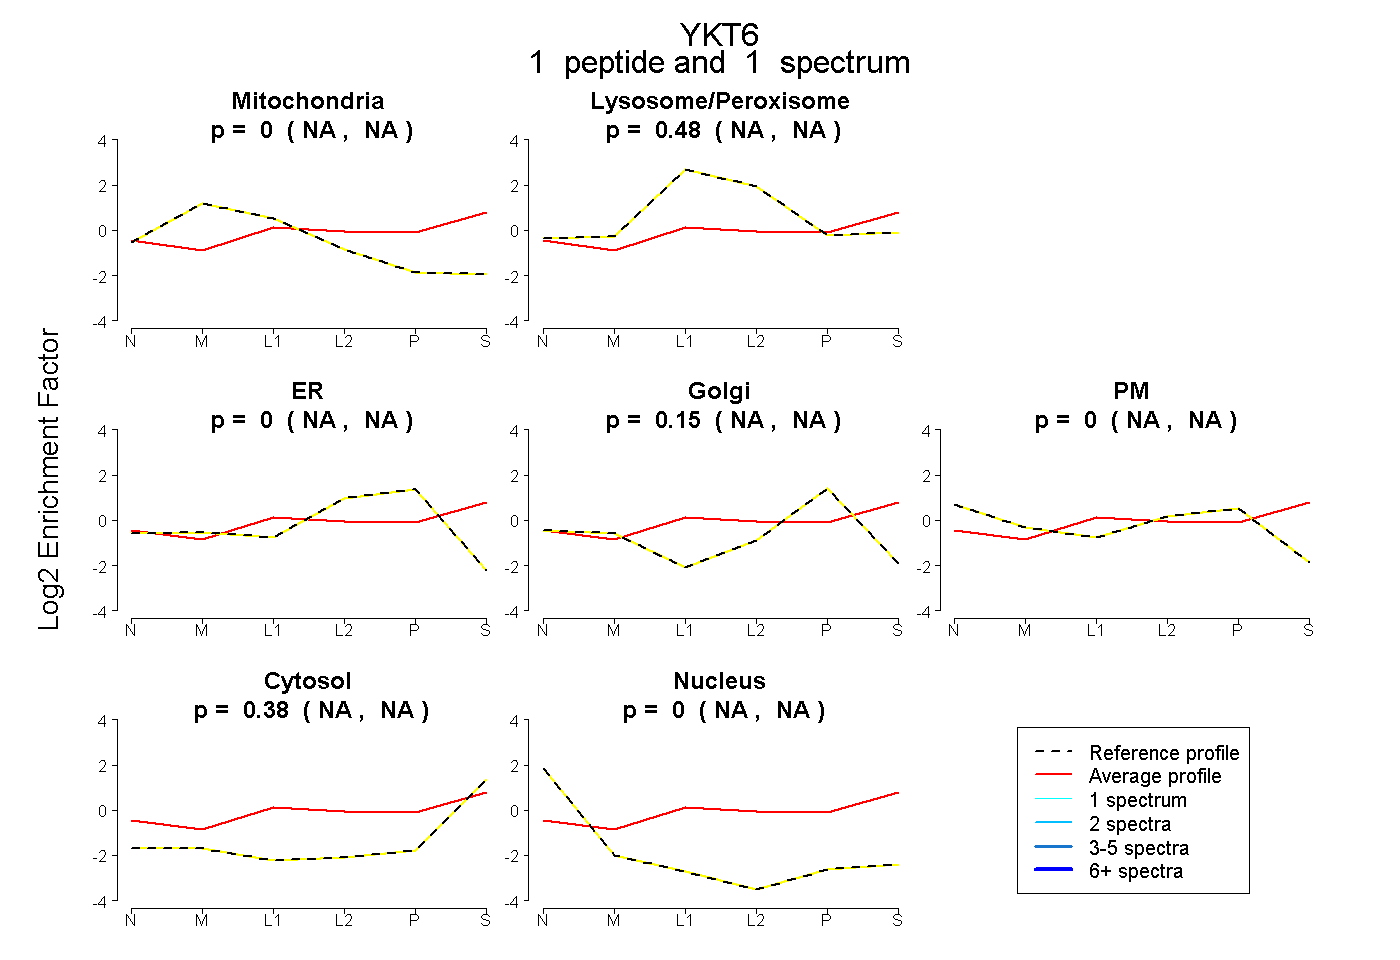
NA | NA
NA | NA
NA | NA
NA | NA
NA | NA
NA | NA
NA | NA
6peptides
spectra
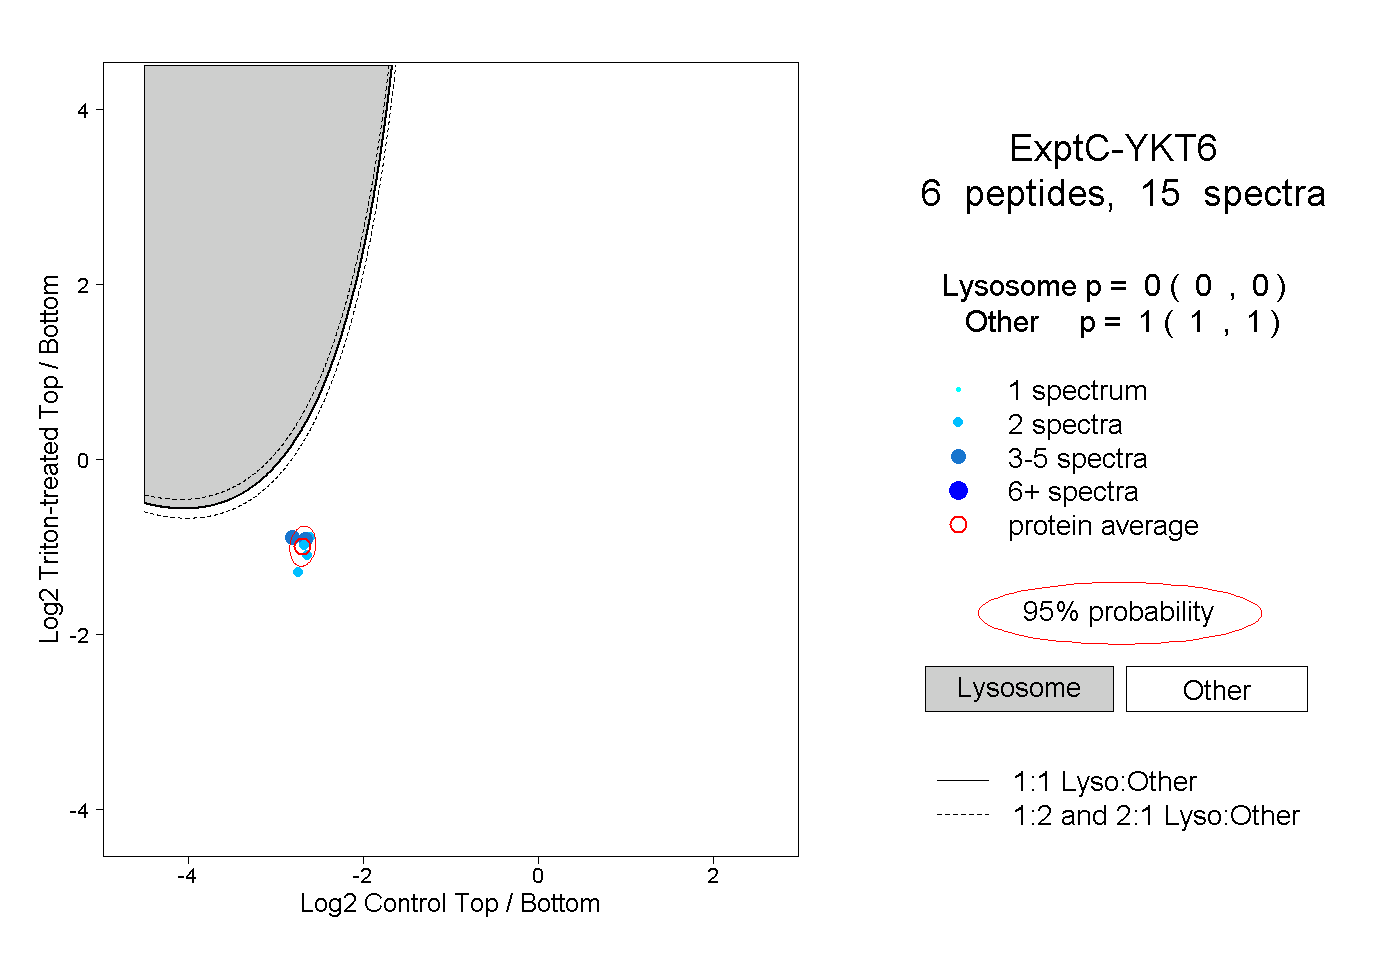
0.000 | 0.000
1.000 | 1.000
1peptide
spectrum
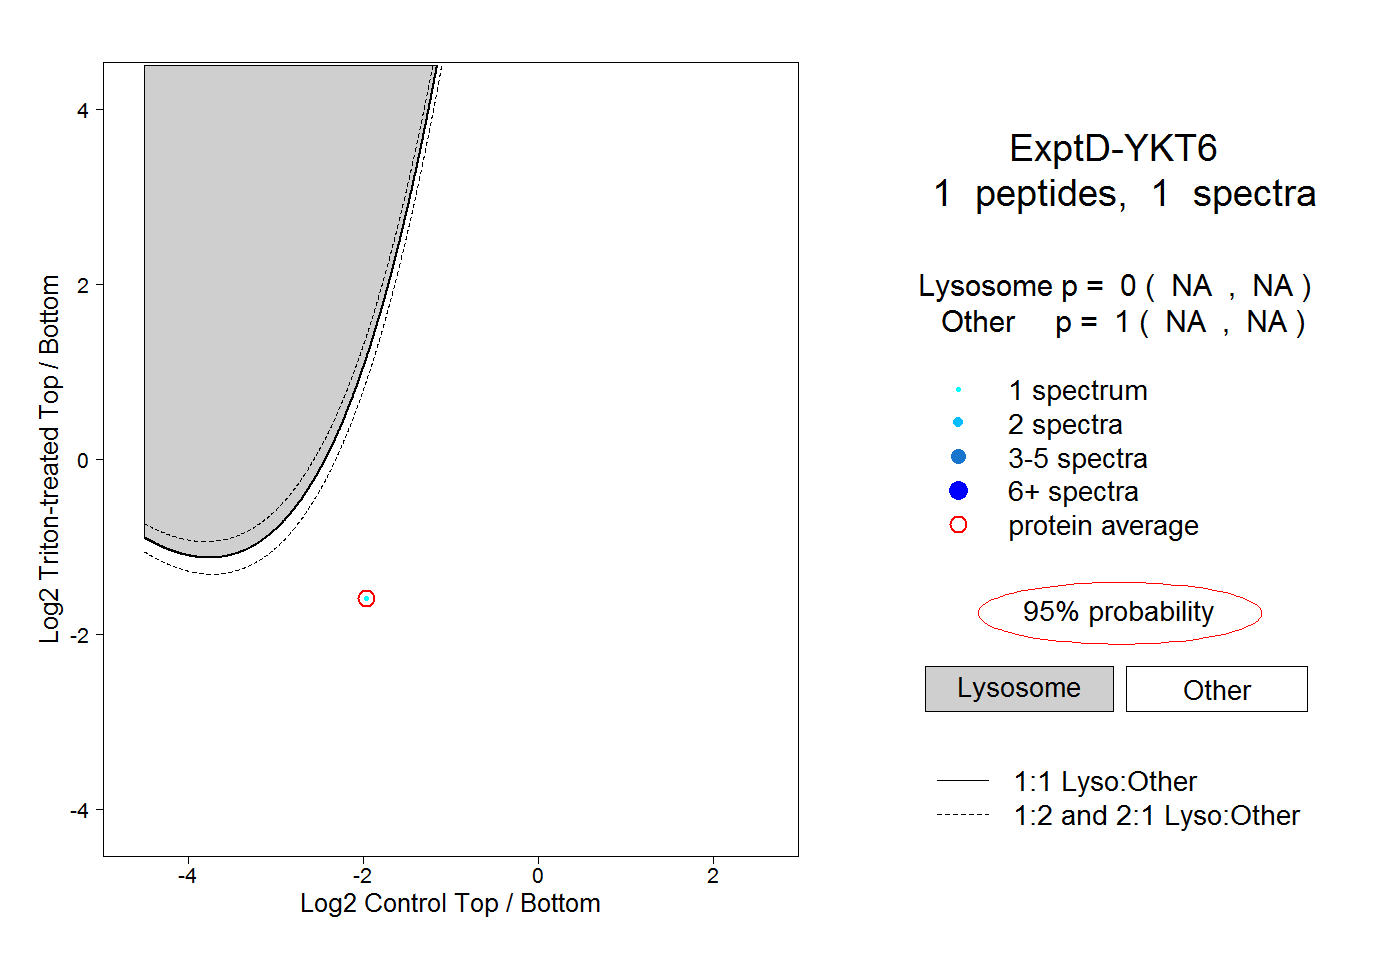
NA | NA
NA | NA