 5
5peptides
spectra
0.000 | 0.000
0.000 | 0.076
0.130 | 0.244
0.000 | 0.000
0.138 | 0.244
0.000 | 0.115
0.487 | 0.533
0.000 | 0.000
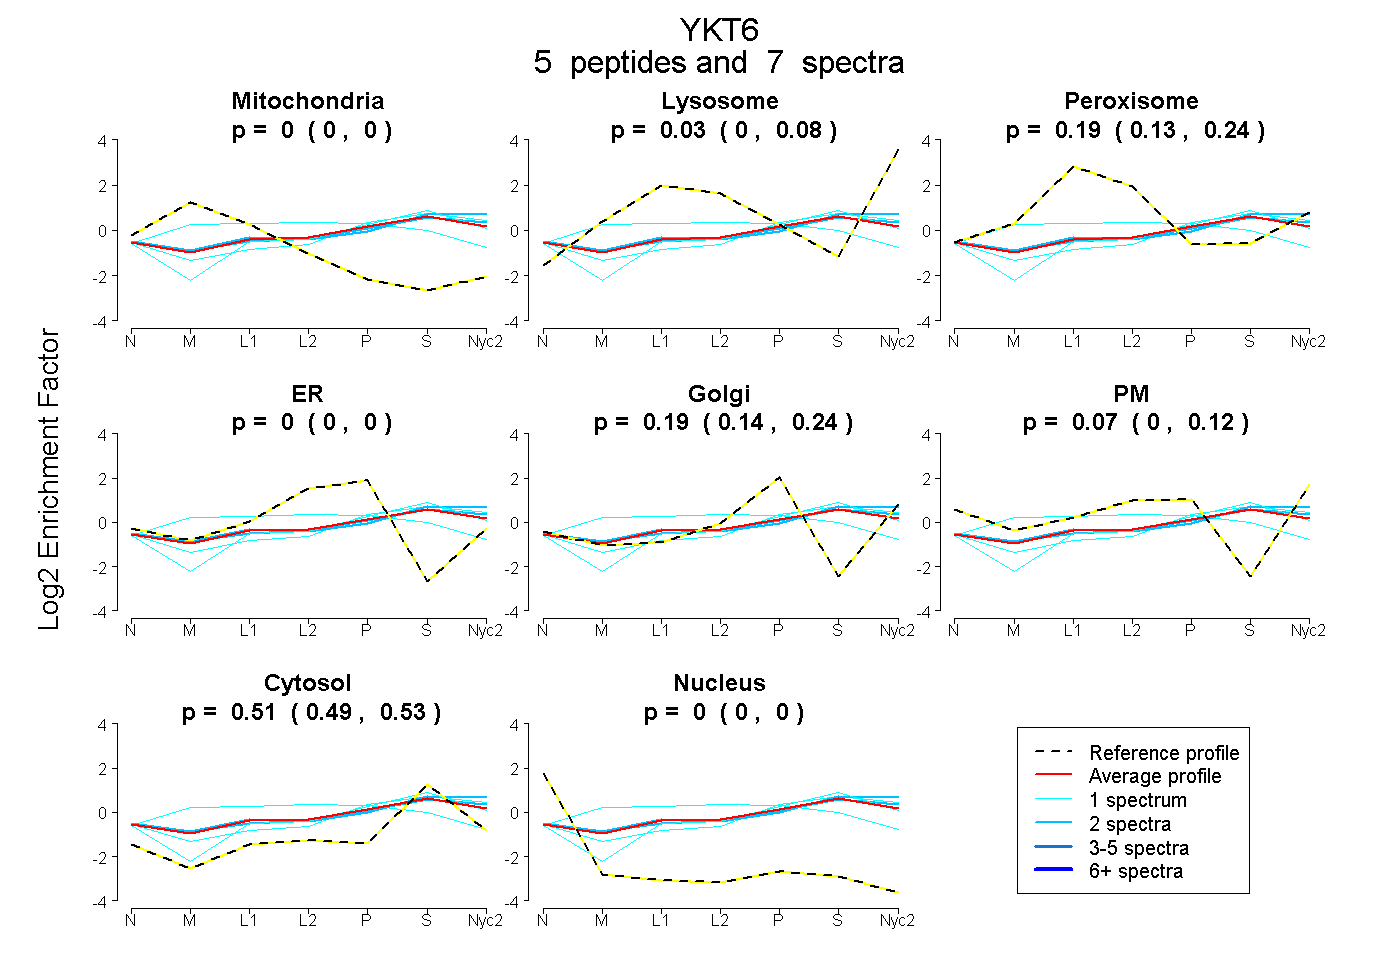
| Plot | Mito | Lyso | Perox | ER | Golgi | PM | Cytosol | Nucleus | |||||
| Expt A |
5 peptides |
7 spectra |
|
0.000 0.000 | 0.000 |
0.034 0.000 | 0.076 |
0.195 0.130 | 0.244 |
0.000 0.000 | 0.000 |
0.194 0.138 | 0.244 |
0.066 0.000 | 0.115 |
0.512 0.487 | 0.533 |
0.000 0.000 | 0.000 |
| 1 spectrum, VQAELDETK | 0.000 | 0.027 | 0.103 | 0.000 | 0.198 | 0.045 | 0.626 | 0.000 | ||
| 2 spectra, VAFTLLEK | 0.000 | 0.192 | 0.038 | 0.000 | 0.000 | 0.208 | 0.562 | 0.000 | ||
| 2 spectra, SDSLAGVVIADSEYPSR | 0.000 | 0.074 | 0.108 | 0.000 | 0.102 | 0.180 | 0.537 | 0.000 | ||
| 1 spectrum, LDDLVSK | 0.000 | 0.120 | 0.000 | 0.000 | 0.203 | 0.093 | 0.583 | 0.000 | ||
| 1 spectrum, EQEYLCHVYVR | 0.137 | 0.000 | 0.301 | 0.261 | 0.000 | 0.000 | 0.301 | 0.000 |
| Plot | Mito | Lyso or Perox | ER | Golgi | PM | Cytosol | Nucleus | ||||||
| Expt B |
1 peptide |
1 spectrum |
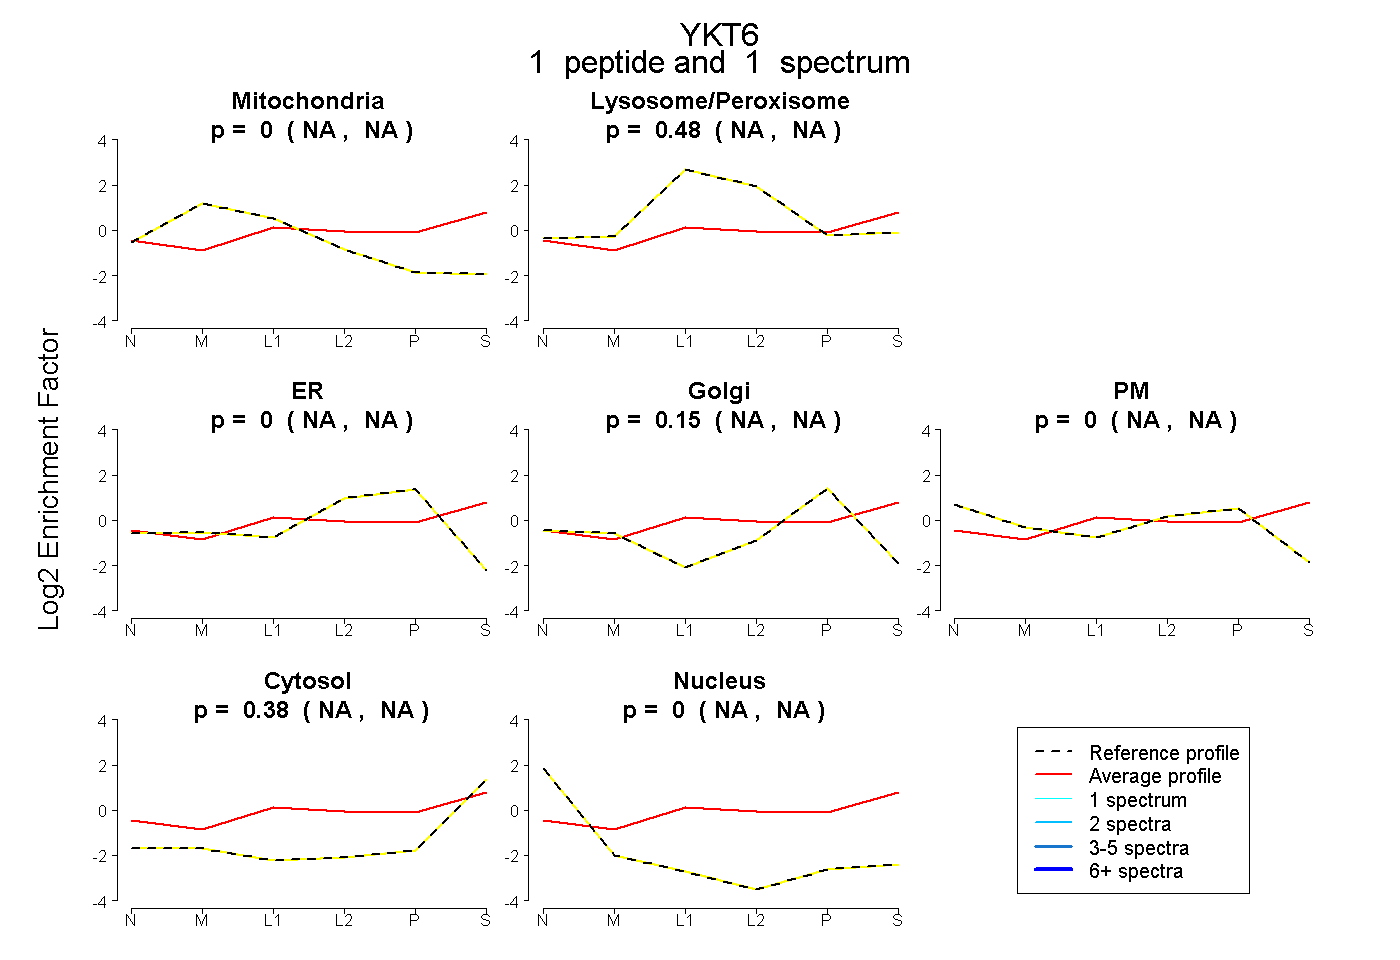 |
0.000 NA | NA |
0.477 NA | NA |
0.000 NA | NA |
0.148 NA | NA |
0.000 NA | NA |
0.376 NA | NA |
0.000 NA | NA |
|||
| Plot | Lyso | Other | |||||||||||
| Expt C |
6 peptides |
15 spectra |
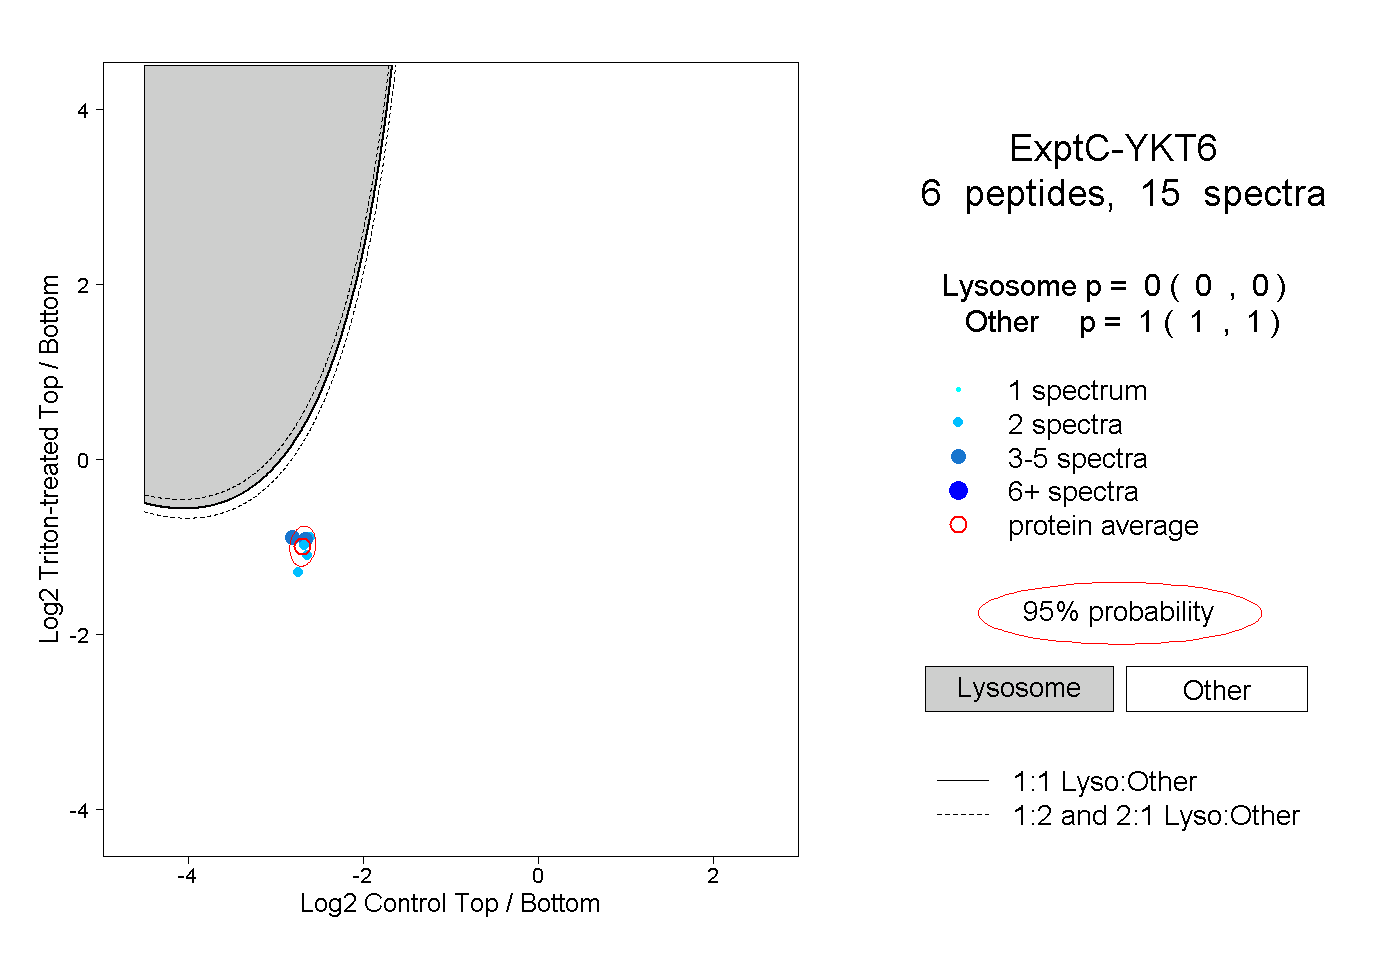 |
0.000 0.000 | 0.000 |
1.000 1.000 | 1.000 |
||||||||
| Plot | Lyso | Other | |||||||||||
| Expt D |
1 peptide |
1 spectrum |
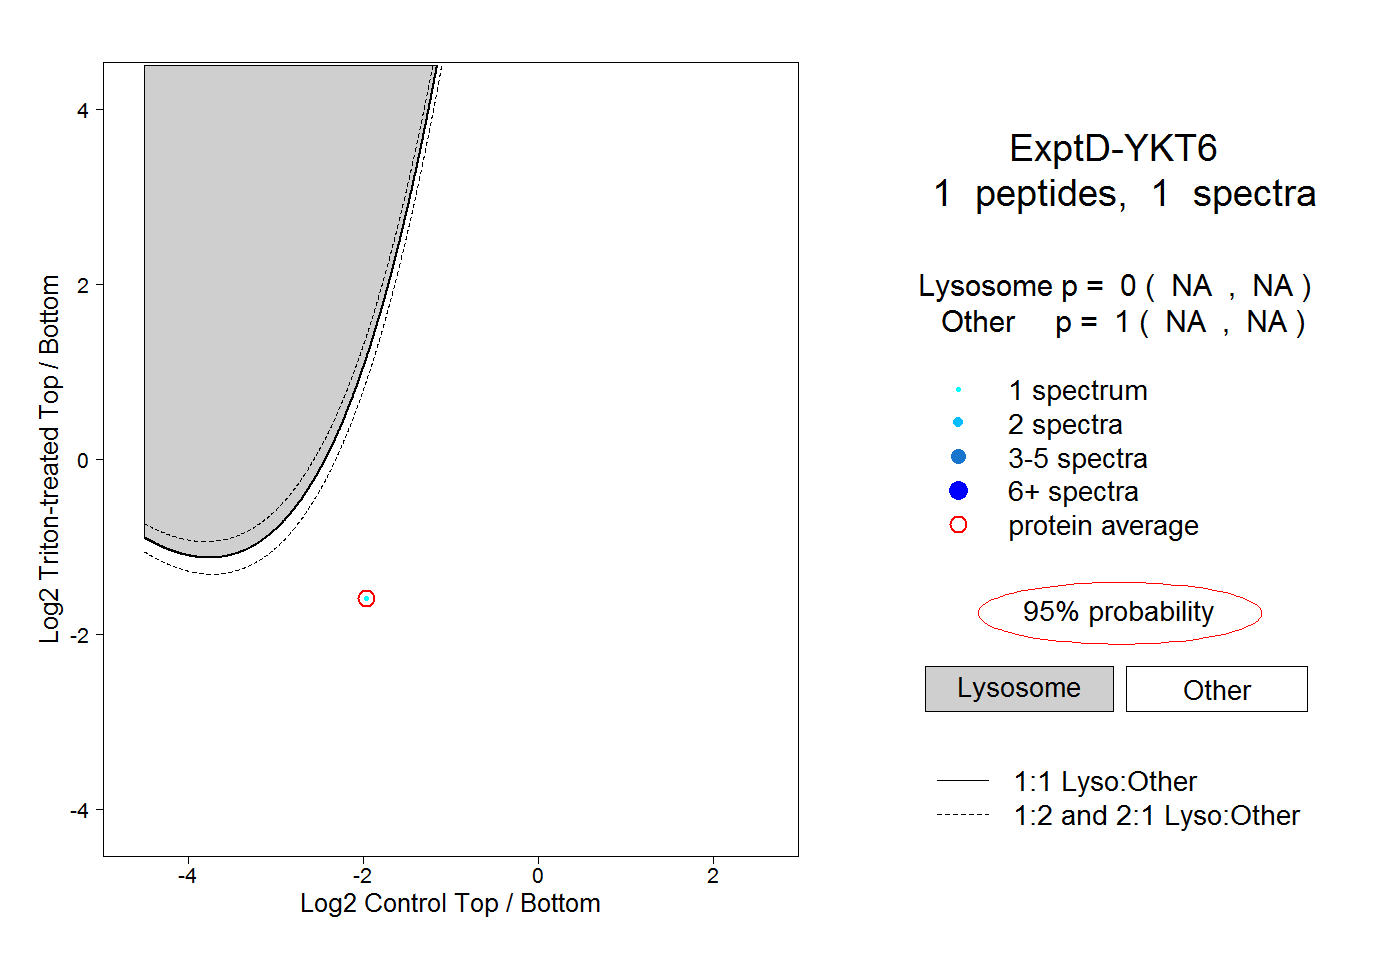 |
0.000 NA | NA |
1.000 NA | NA |