 16
16peptides
spectra
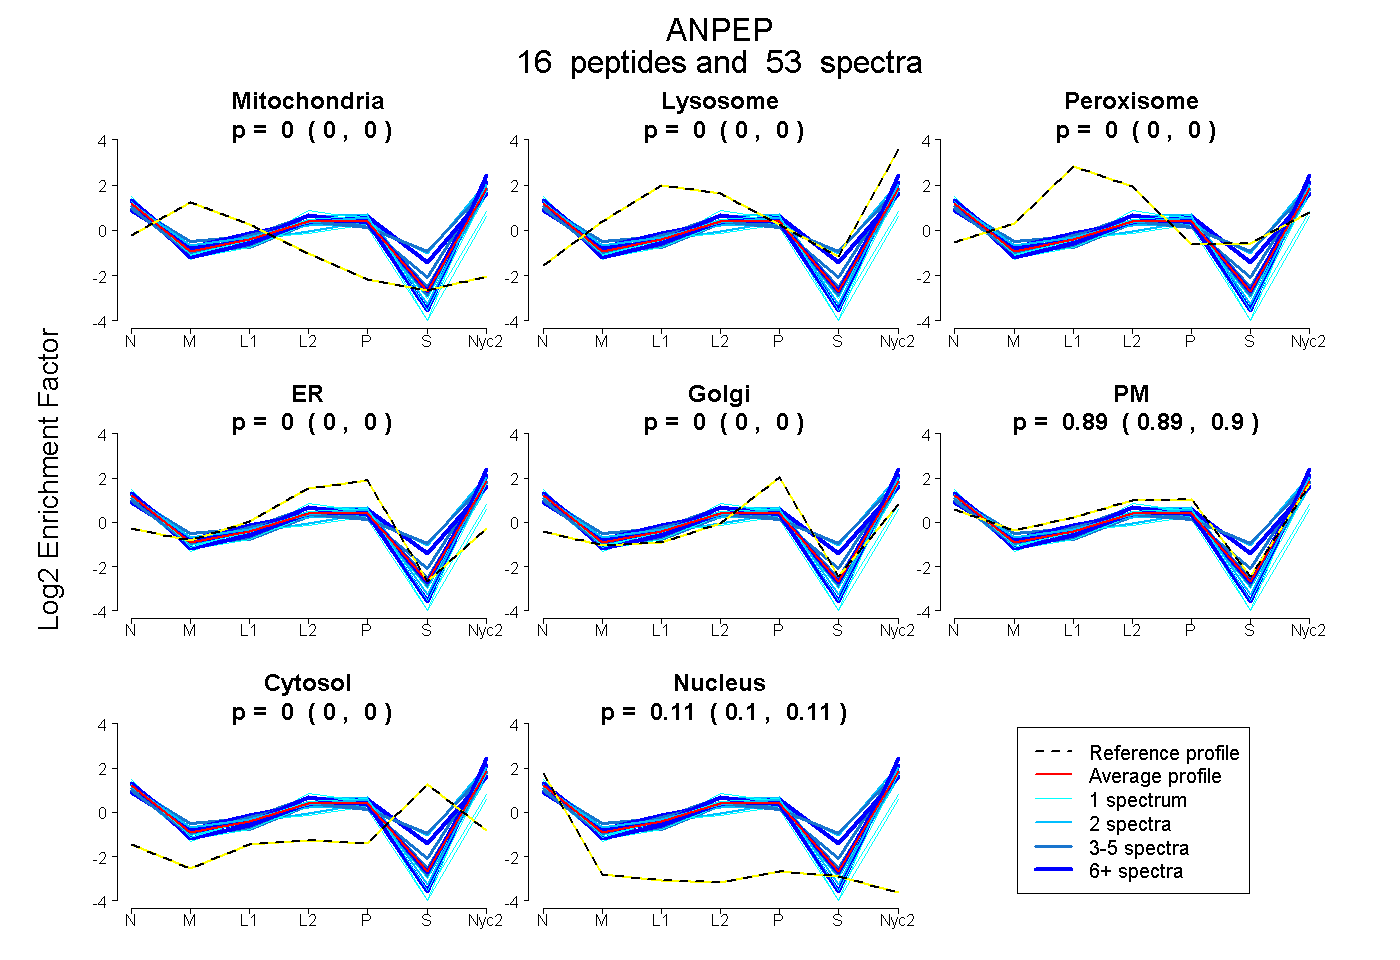
0.000 | 0.000
0.000 | 0.000
0.000 | 0.000
0.000 | 0.000
0.000 | 0.000
0.891 | 0.895
0.000 | 0.000
0.104 | 0.108
5peptides
spectra
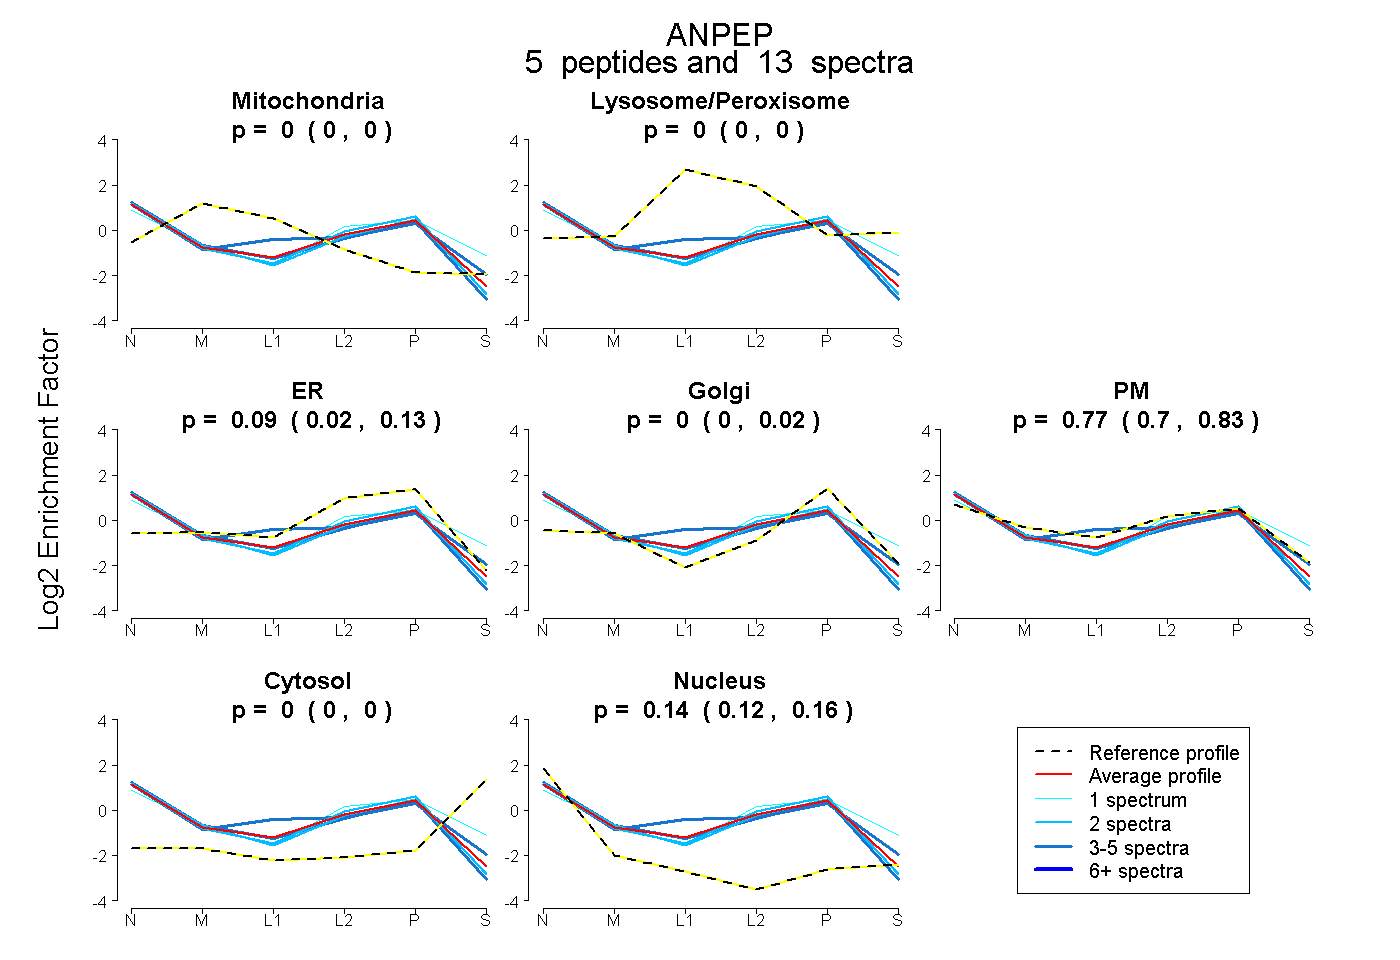
0.000 | 0.000
0.000 | 0.000
0.024 | 0.128
0.000 | 0.017
0.704 | 0.834
0.000 | 0.000
0.122 | 0.156
17peptides
spectra
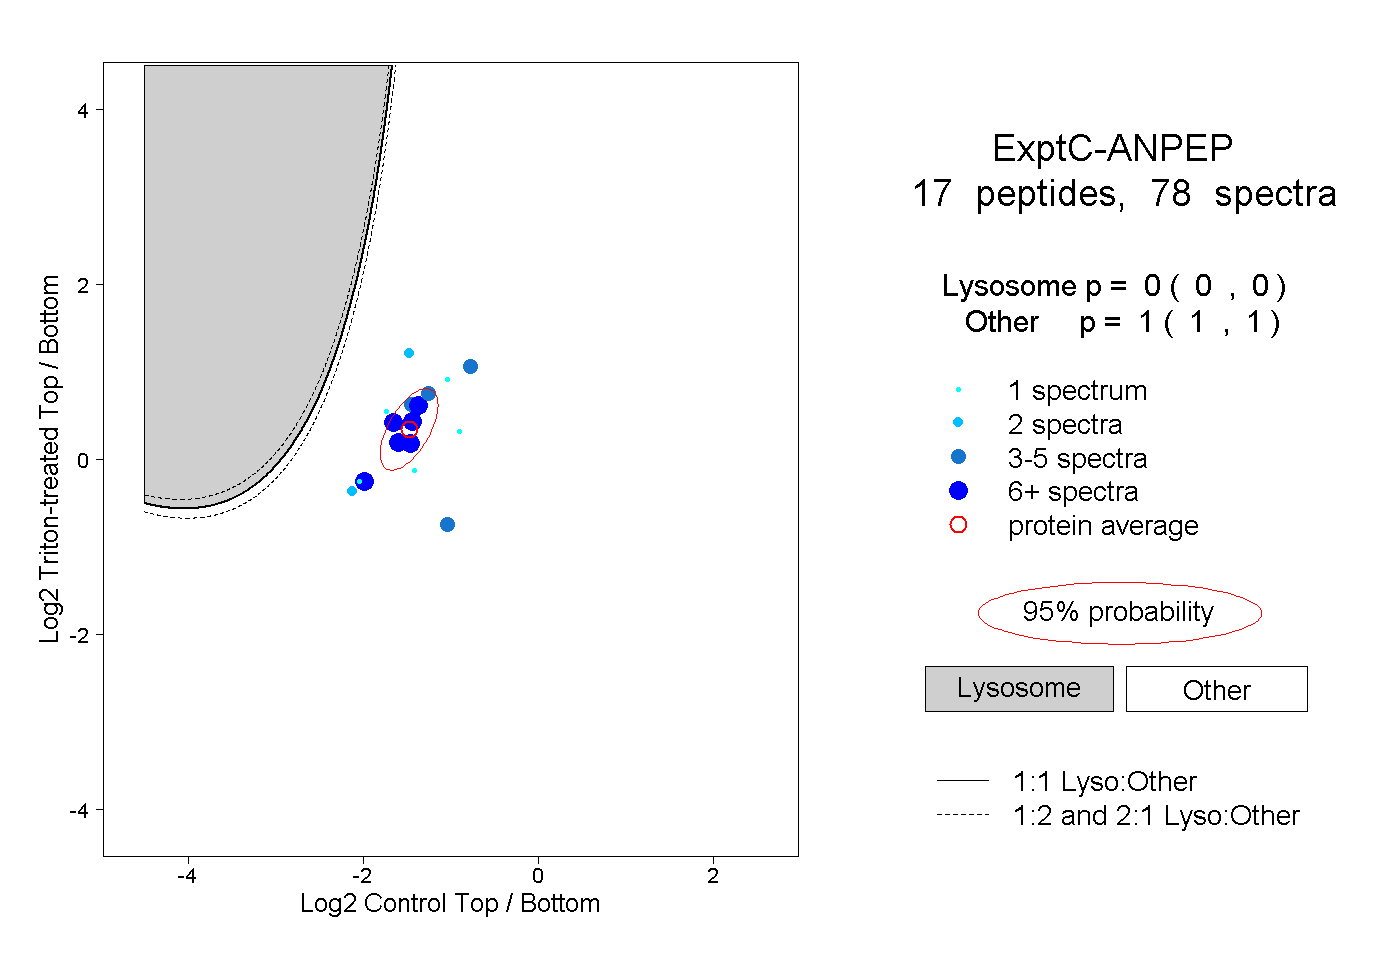
0.000 | 0.000
1.000 | 1.000
5peptides
spectra
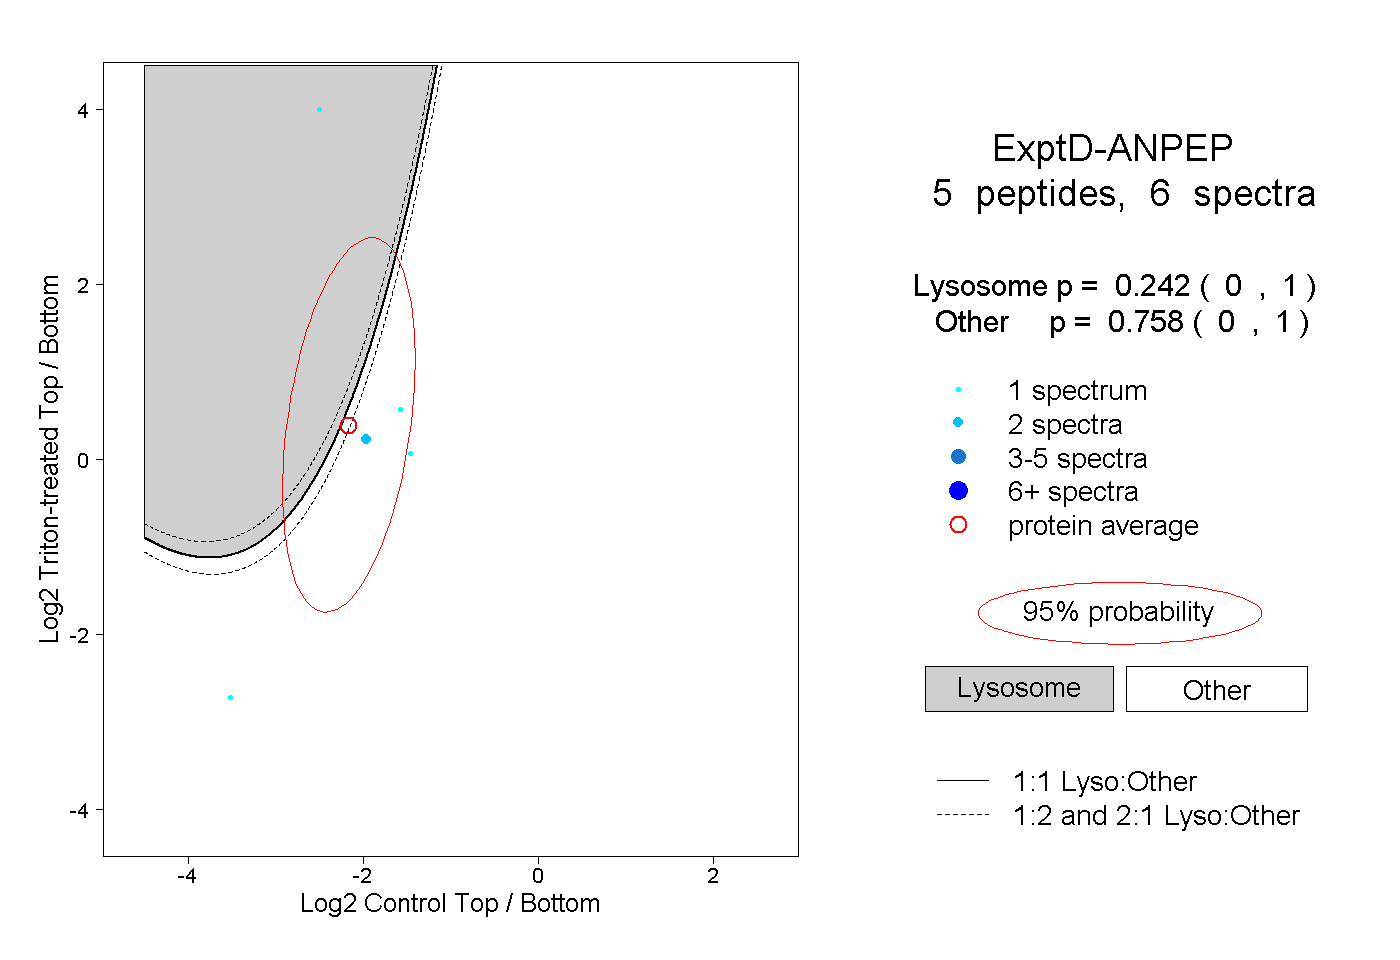
0.000 | 1.000
0.000 | 1.000