ANPEP
[ENSRNOP00000020002]
Main page
| | | Plot |
Mito |
Lyso |
|
Perox |
ER |
Golgi |
PM |
Cytosol |
Nucleus |
|
| Expt A |
 16
16
peptides |
53
spectra |
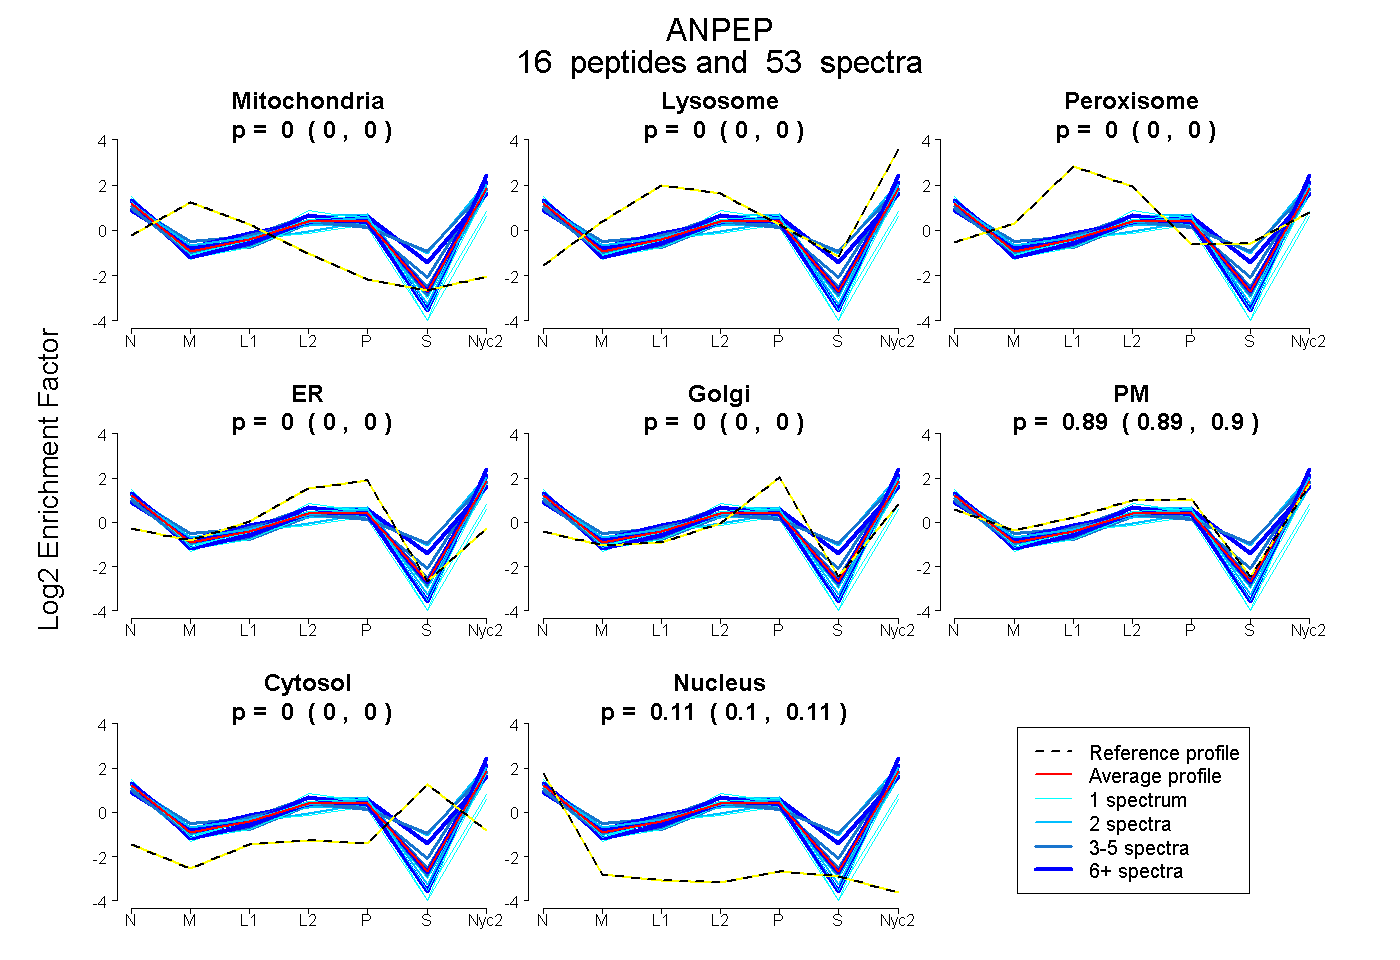 |
0.000
0.000 | 0.000 |
0.000
0.000 | 0.000 |
|
0.000
0.000 | 0.000 |
0.000
0.000 | 0.000 |
0.000
0.000 | 0.000 |
0.893
0.891 | 0.895 |
0.000
0.000 | 0.000 |
0.107
0.104 | 0.108 |
|
| | | Plot |
Mito |
|
Lyso or Perox |
|
ER |
Golgi |
PM |
Cytosol |
Nucleus |
|
| Expt B |
5
peptides |
13
spectra |
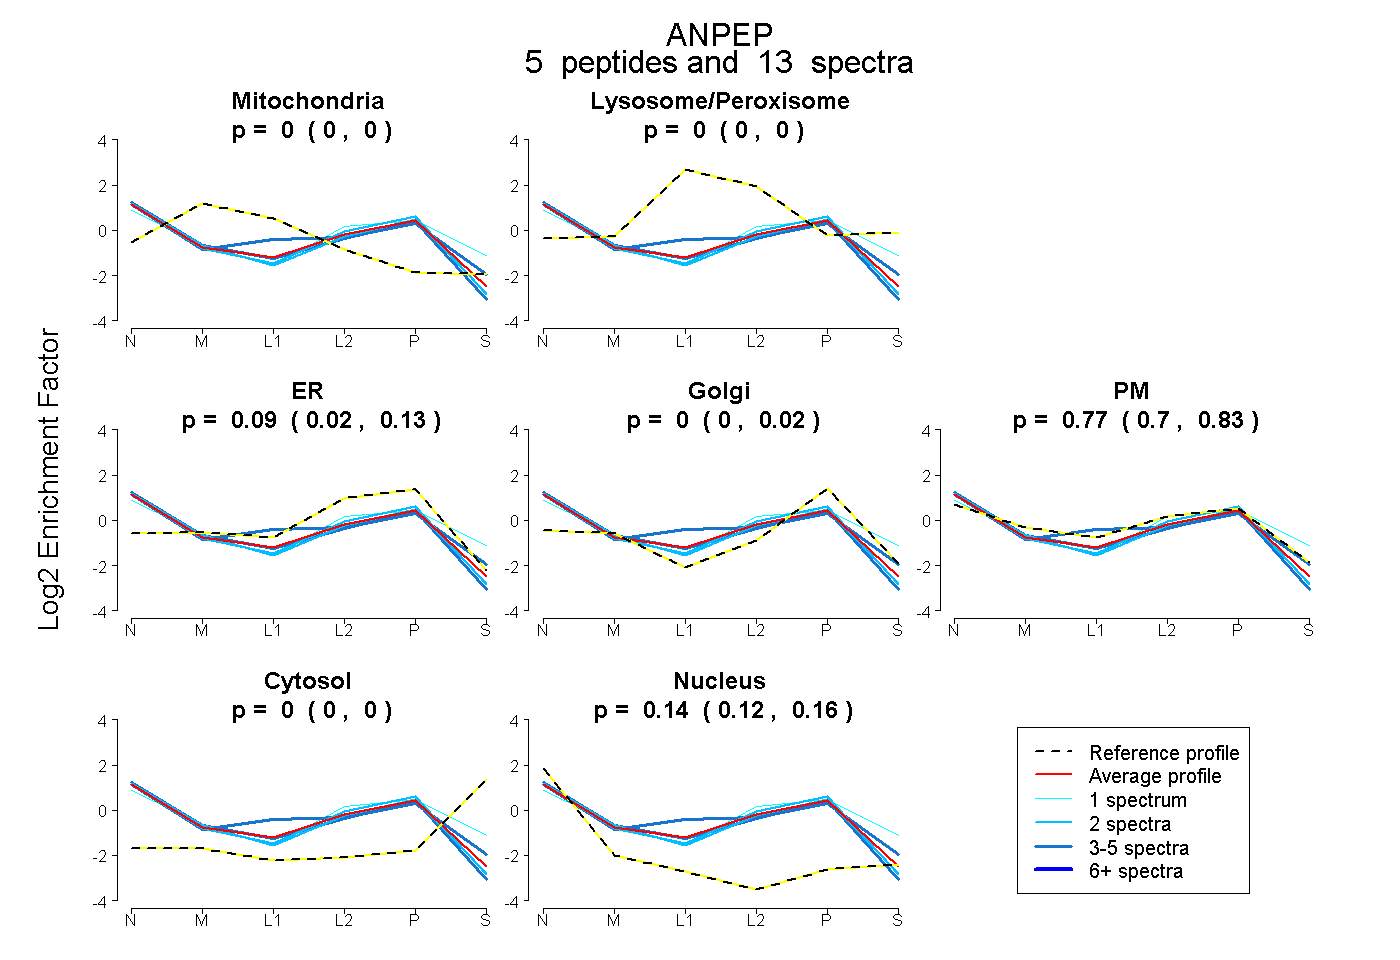 |
0.000
0.000 | 0.000 |
|
0.000
0.000 | 0.000 |
|
0.086
0.024 | 0.128 |
0.000
0.000 | 0.017 |
0.772
0.704 | 0.834 |
0.000
0.000 | 0.000 |
0.141
0.122 | 0.156 |
|
| 2 spectra, YLSYTLNPDYIR |
0.000 |
|
0.000 |
|
0.279 |
0.000 |
0.542 |
0.000 |
0.179 |
|
| 1 spectrum, MLSSFLTEDLFK |
0.000 |
|
0.000 |
|
0.000 |
0.033 |
0.847 |
0.118 |
0.002 |
|
| 4 spectra, DLIVLNDVYR |
0.000 |
|
0.000 |
|
0.166 |
0.000 |
0.640 |
0.000 |
0.193 |
|
| 4 spectra, QVTPLFAYFK |
0.000 |
|
0.093 |
|
0.000 |
0.000 |
0.769 |
0.000 |
0.139 |
|
| 2 spectra, YVEAVSPNR |
0.000 |
|
0.000 |
|
0.153 |
0.048 |
0.617 |
0.000 |
0.182 |
|
| | | Plot |
|
Lyso |
|
|
|
|
|
|
|
Other |
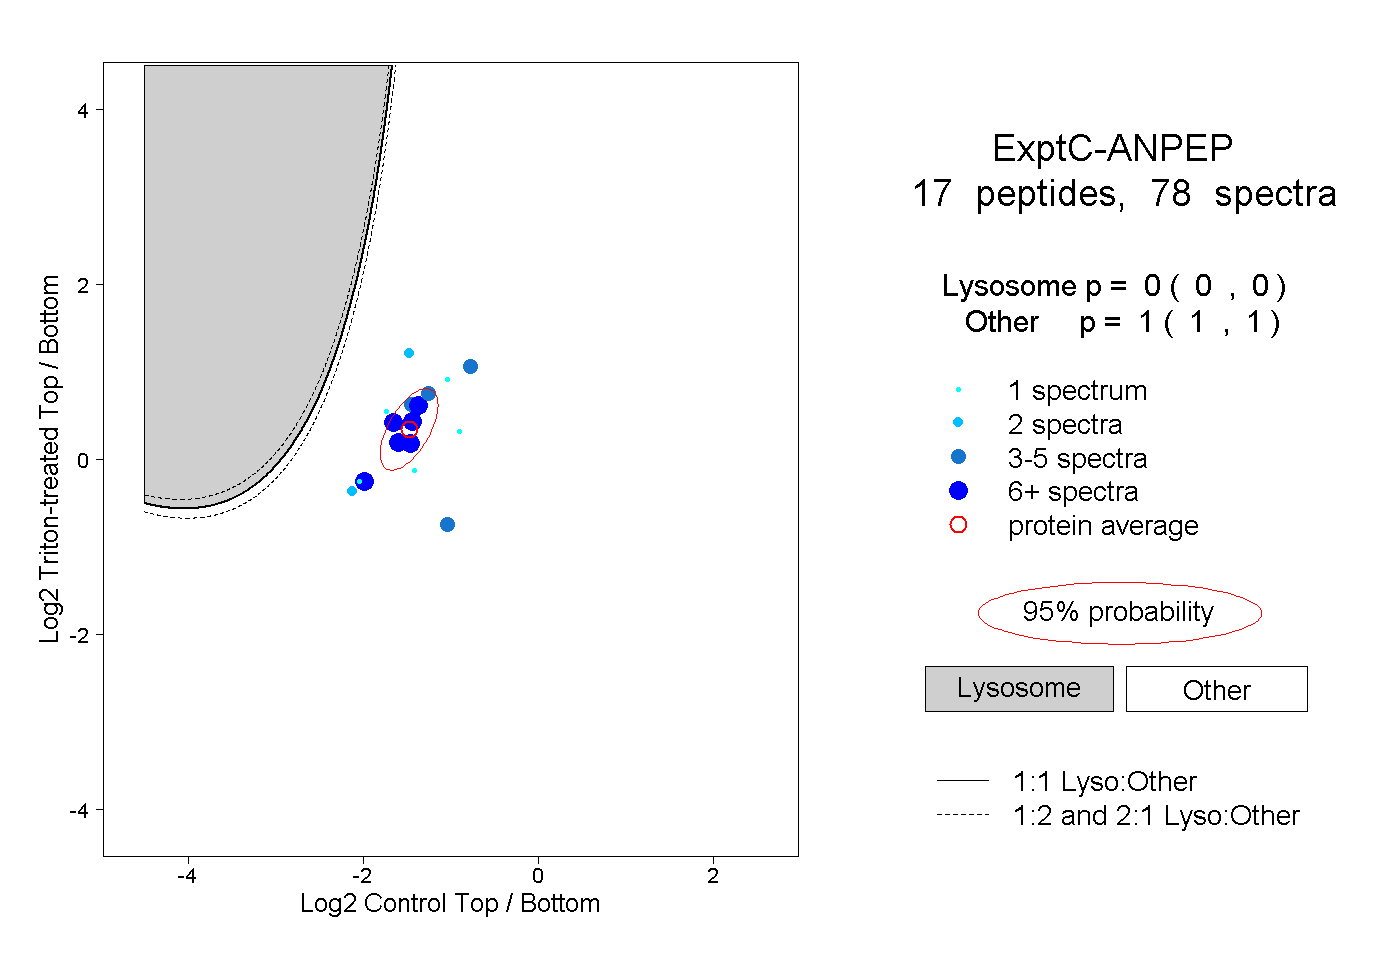
| Expt C |
17
peptides |
78
spectra |
 |
|
0.000
0.000 | 0.000 |
|
|
|
|
|
|
|
1.000
1.000 | 1.000 |
| | | Plot |
|
Lyso |
|
|
|
|
|
|
|
Other |
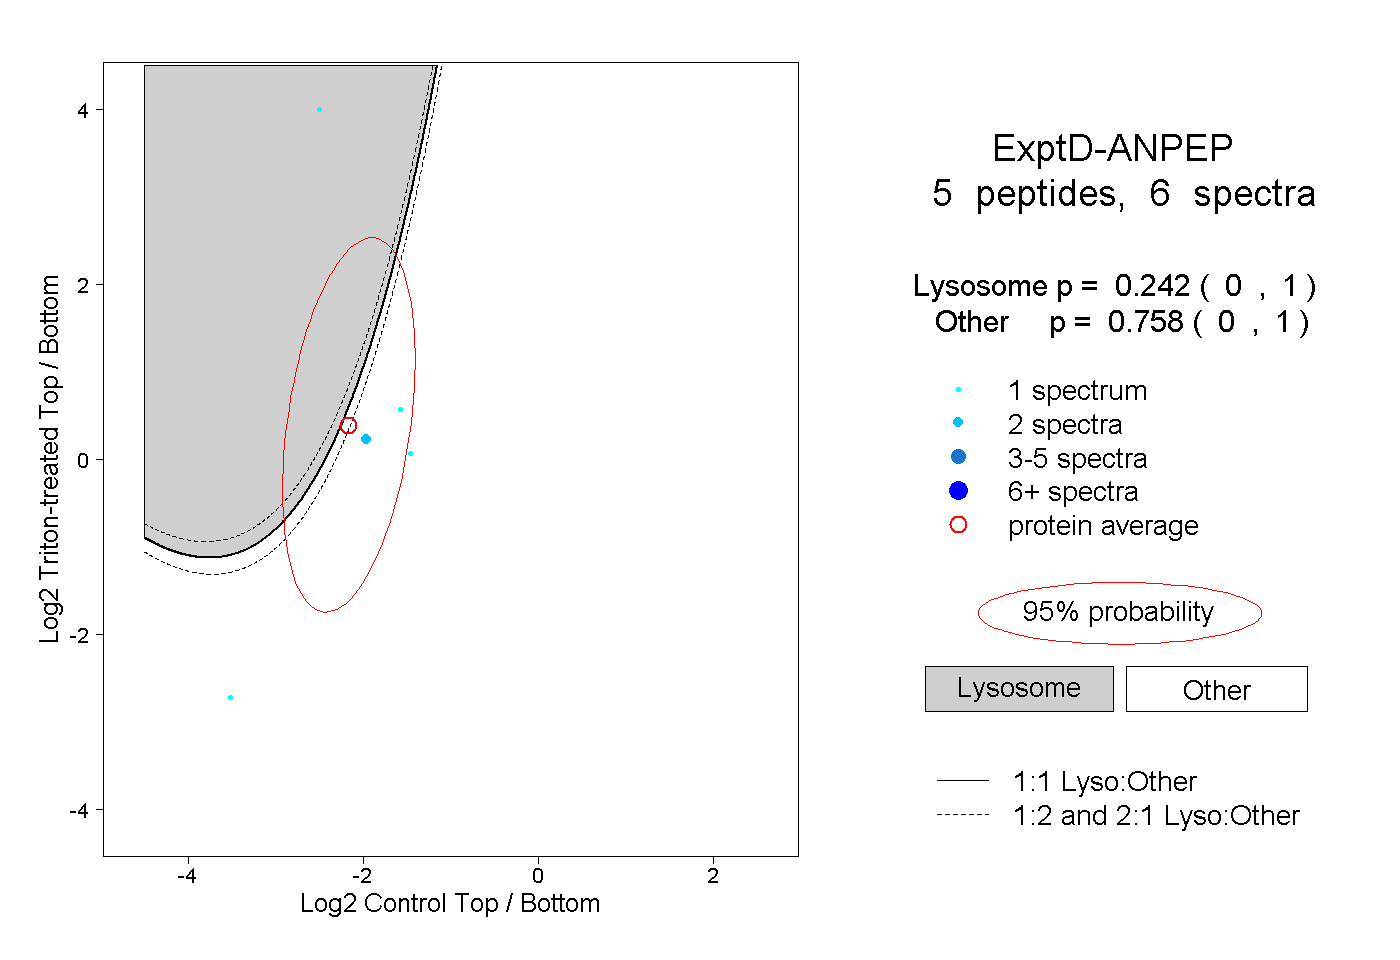
| Expt D |
5
peptides |
6
spectra |
 |
|
0.242
0.000 | 1.000 |
|
|
|
|
|
|
|
0.758
0.000 | 1.000 |