 4
4peptides
spectra
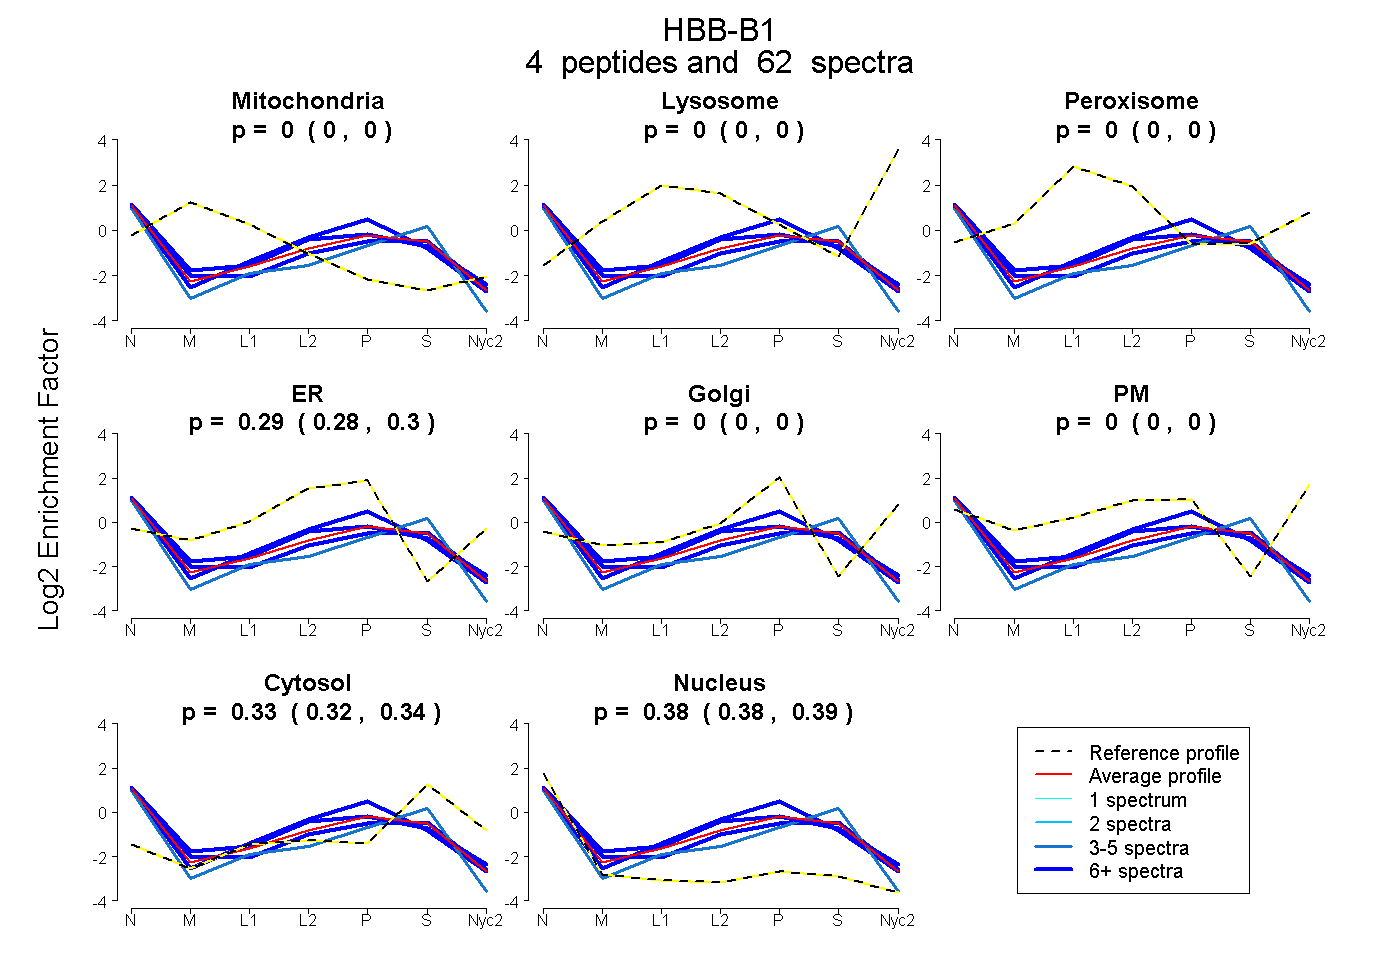
0.000 | 0.000
0.000 | 0.000
0.000 | 0.000
0.281 | 0.298
0.000 | 0.000
0.000 | 0.000
0.318 | 0.336
0.375 | 0.389
2peptides
spectra
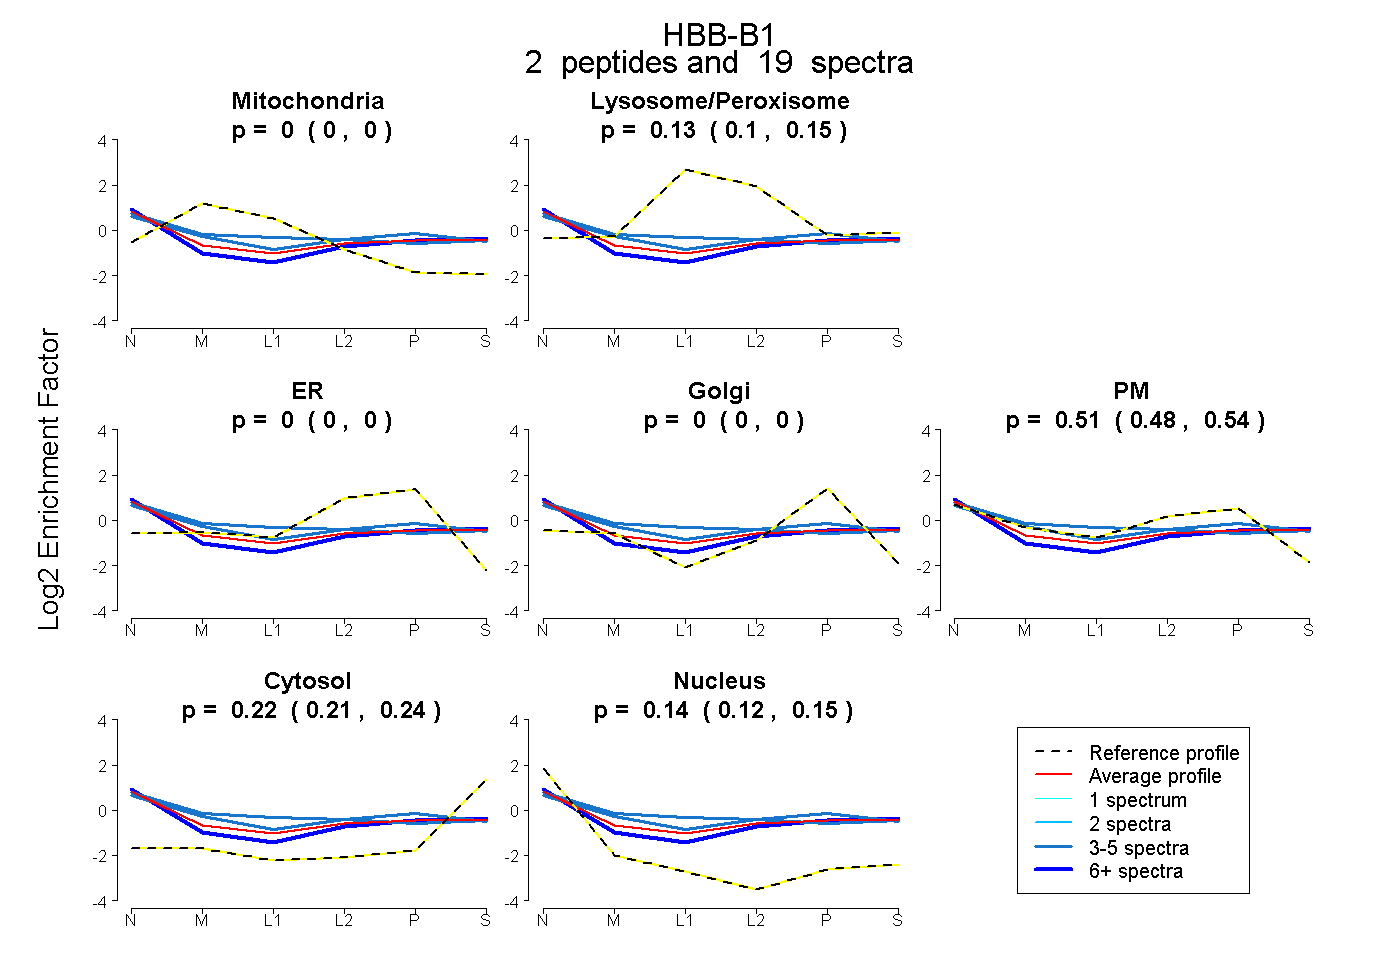
0.000 | 0.000
0.097 | 0.151
0.000 | 0.000
0.000 | 0.000
0.479 | 0.540
0.208 | 0.238
0.119 | 0.151
3peptides
spectra
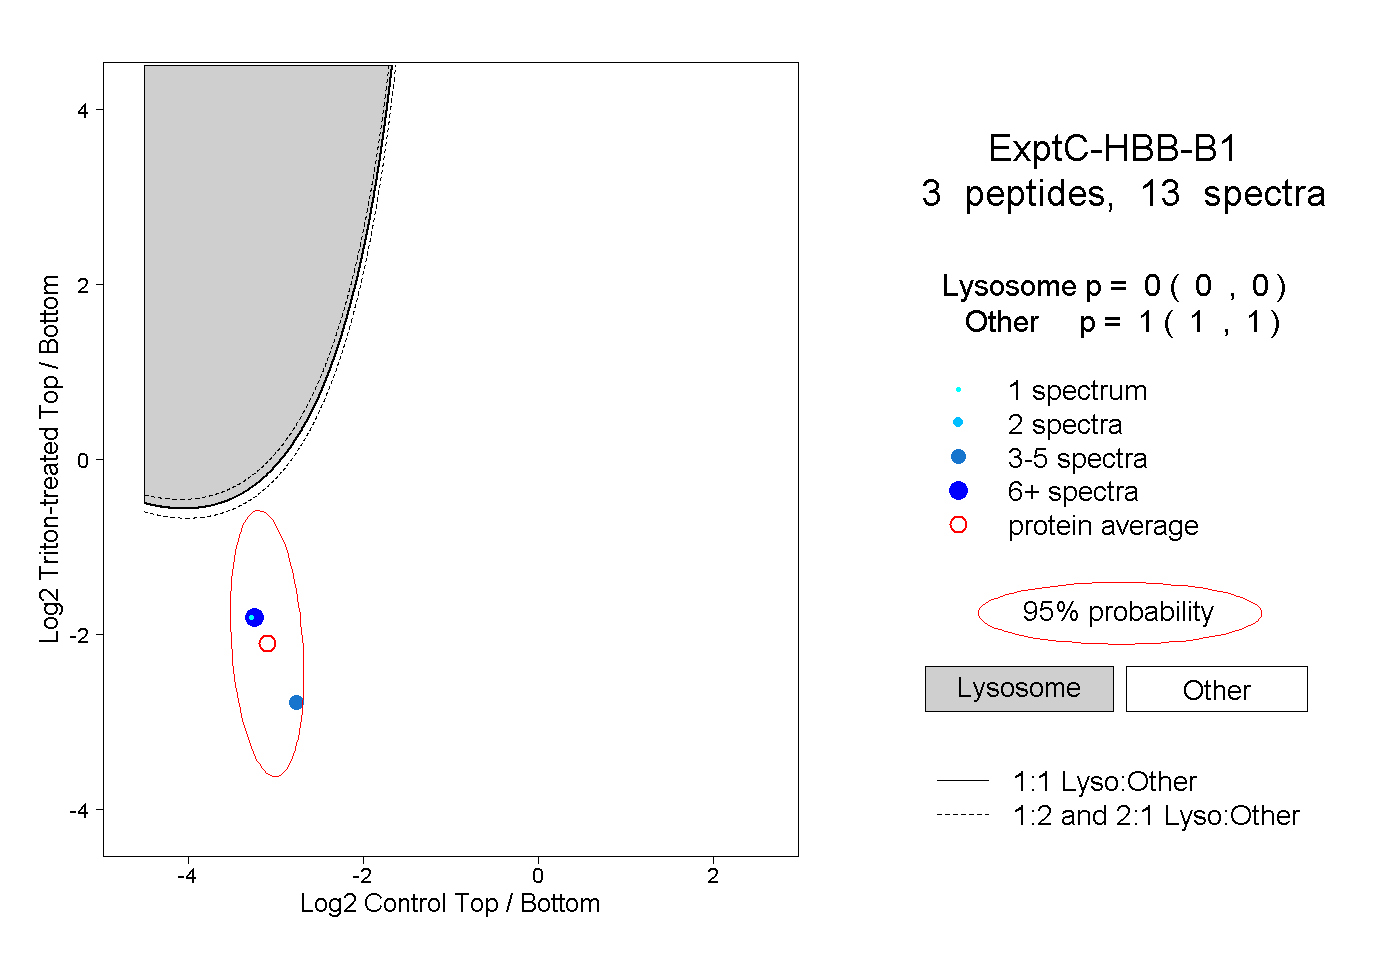
0.000 | 0.000
1.000 | 1.000
2peptides
spectra
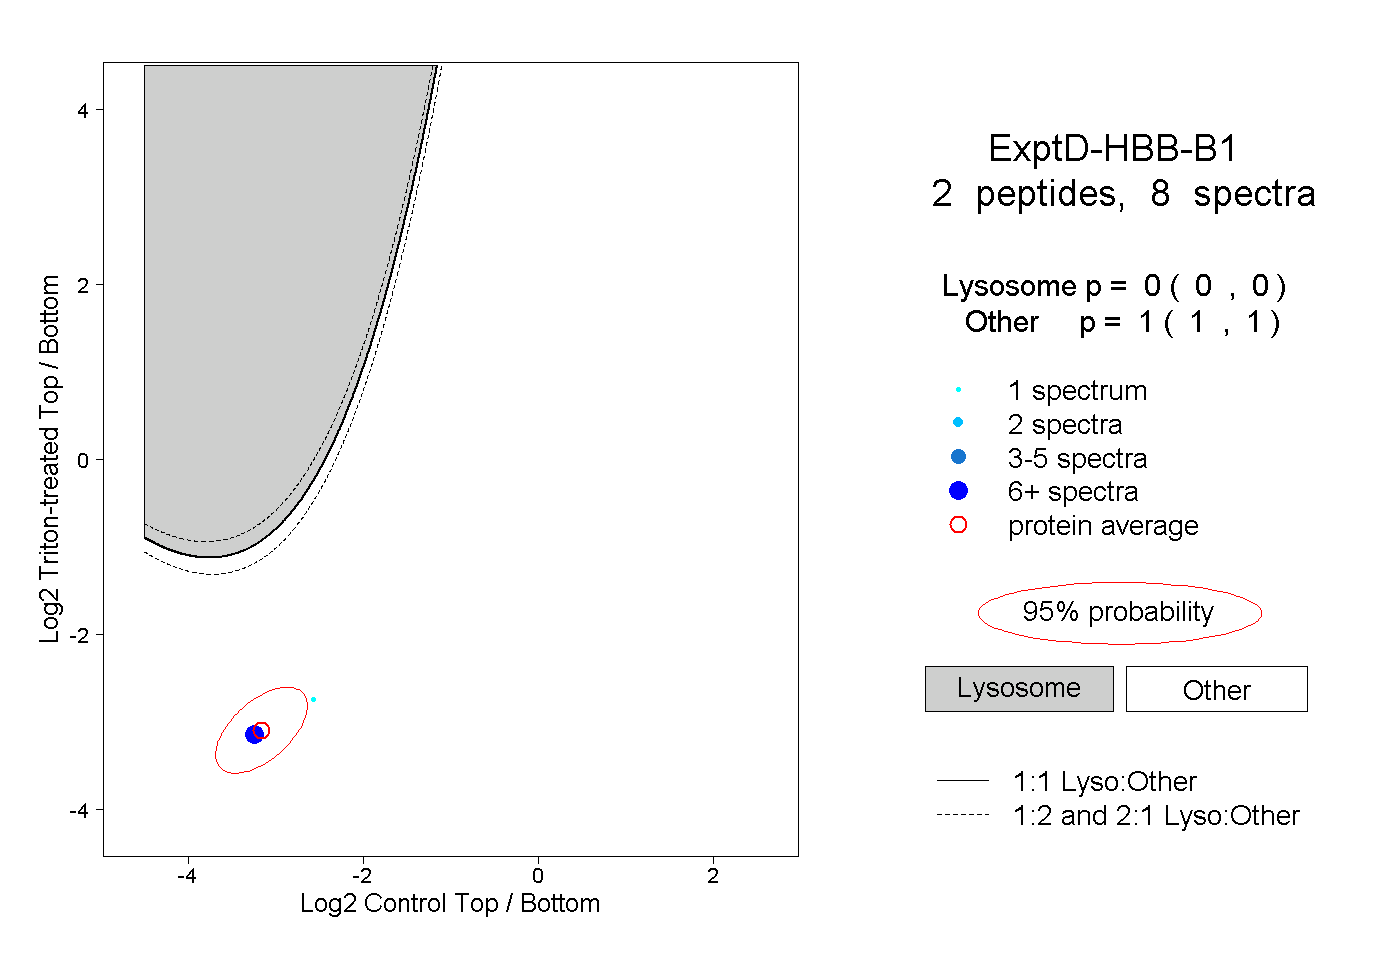
0.000 | 0.000
1.000 | 1.000