 4
4peptides
spectra
0.000 | 0.000
0.000 | 0.000
0.000 | 0.000
0.281 | 0.298
0.000 | 0.000
0.000 | 0.000
0.318 | 0.336
0.375 | 0.389
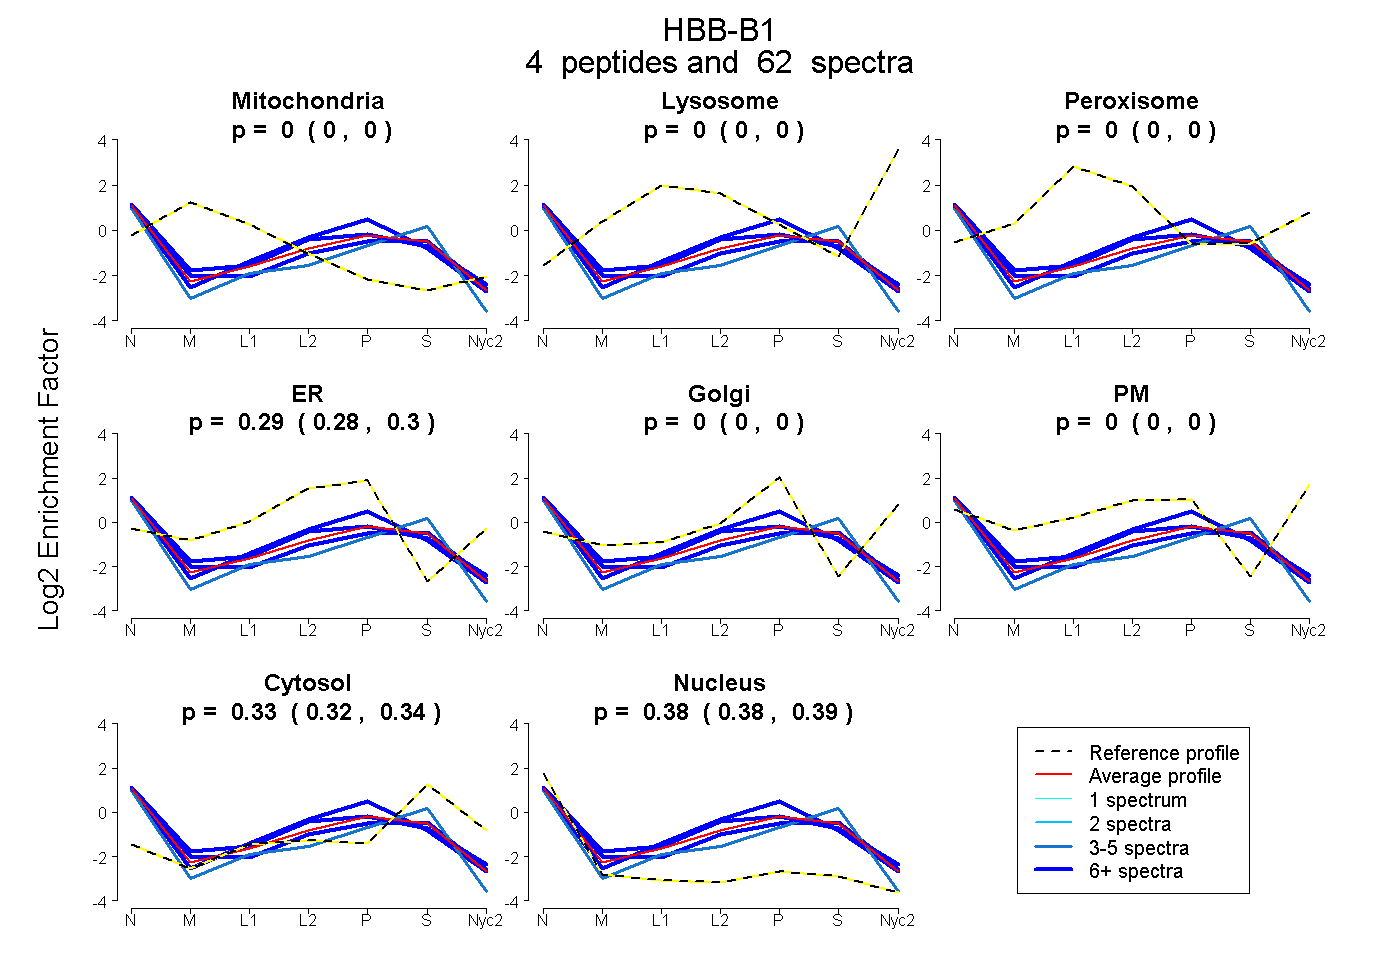
| Plot | Mito | Lyso | Perox | ER | Golgi | PM | Cytosol | Nucleus | |||||
| Expt A |
4 peptides |
62 spectra |
|
0.000 0.000 | 0.000 |
0.000 0.000 | 0.000 |
0.000 0.000 | 0.000 |
0.290 0.281 | 0.298 |
0.000 0.000 | 0.000 |
0.000 0.000 | 0.000 |
0.328 0.318 | 0.336 |
0.383 0.375 | 0.389 |
| 5 spectra, GTFGSLSELHCDK | 0.000 | 0.000 | 0.000 | 0.069 | 0.000 | 0.000 | 0.470 | 0.461 | ||
| 10 spectra, FGDLSSVSAIMGNPQVK | 0.000 | 0.000 | 0.000 | 0.242 | 0.000 | 0.000 | 0.343 | 0.415 | ||
| 31 spectra, EFTPSAQAAFQK | 0.000 | 0.000 | 0.000 | 0.411 | 0.000 | 0.000 | 0.238 | 0.351 | ||
| 16 spectra, LLGNMIVIMMGHHLGK | 0.000 | 0.000 | 0.004 | 0.367 | 0.000 | 0.000 | 0.271 | 0.359 |
| Plot | Mito | Lyso or Perox | ER | Golgi | PM | Cytosol | Nucleus | ||||||
| Expt B |
2 peptides |
19 spectra |
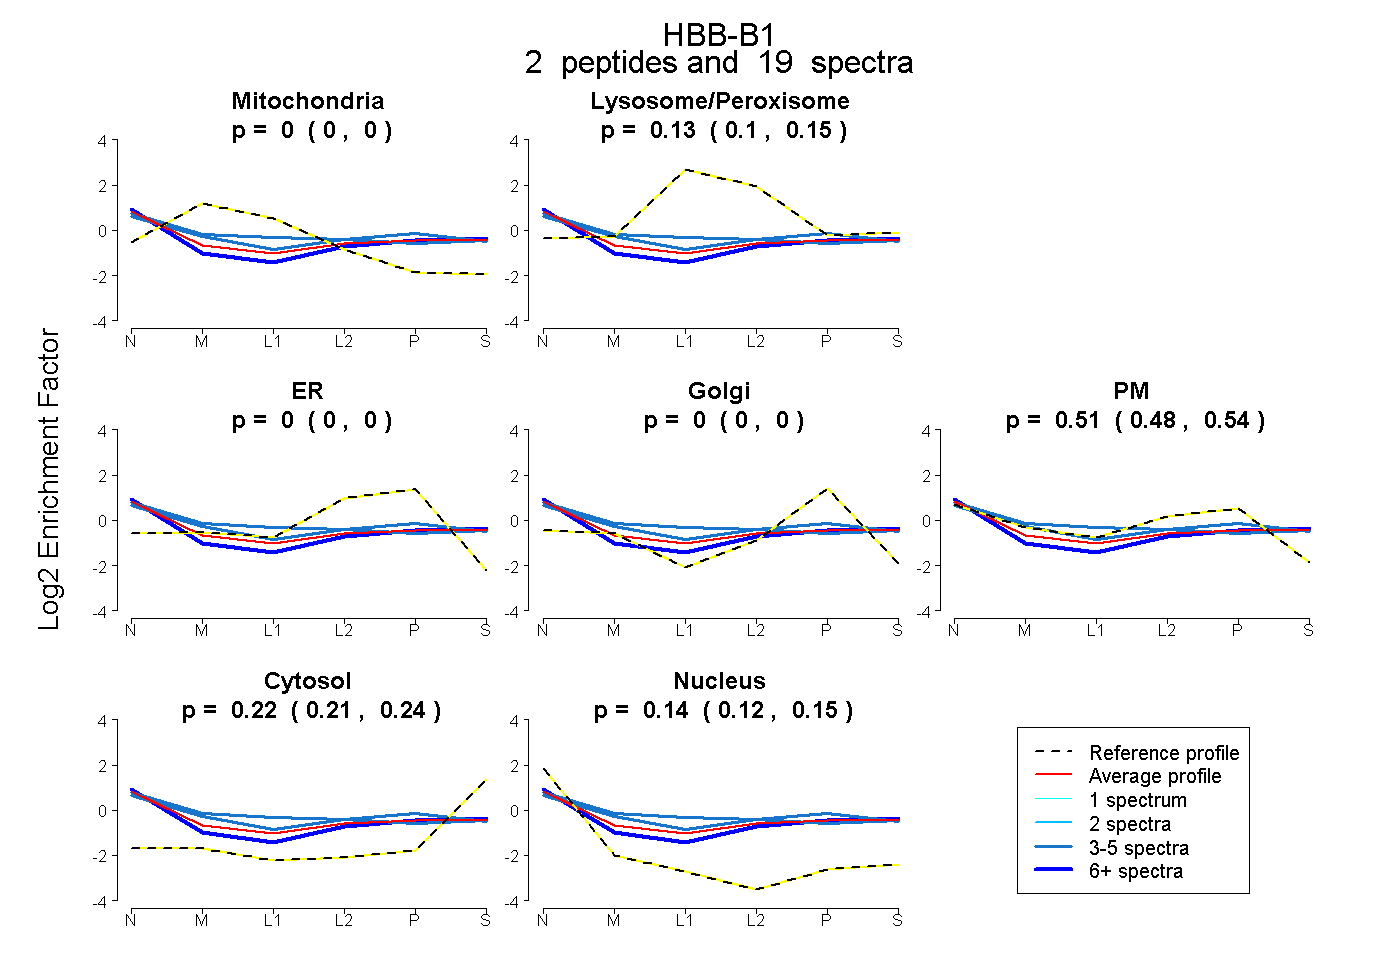 |
0.000 0.000 | 0.000 |
0.127 0.097 | 0.151 |
0.000 0.000 | 0.000 |
0.000 0.000 | 0.000 |
0.512 0.479 | 0.540 |
0.225 0.208 | 0.238 |
0.137 0.119 | 0.151 |
|||
| Plot | Lyso | Other | |||||||||||
| Expt C |
3 peptides |
13 spectra |
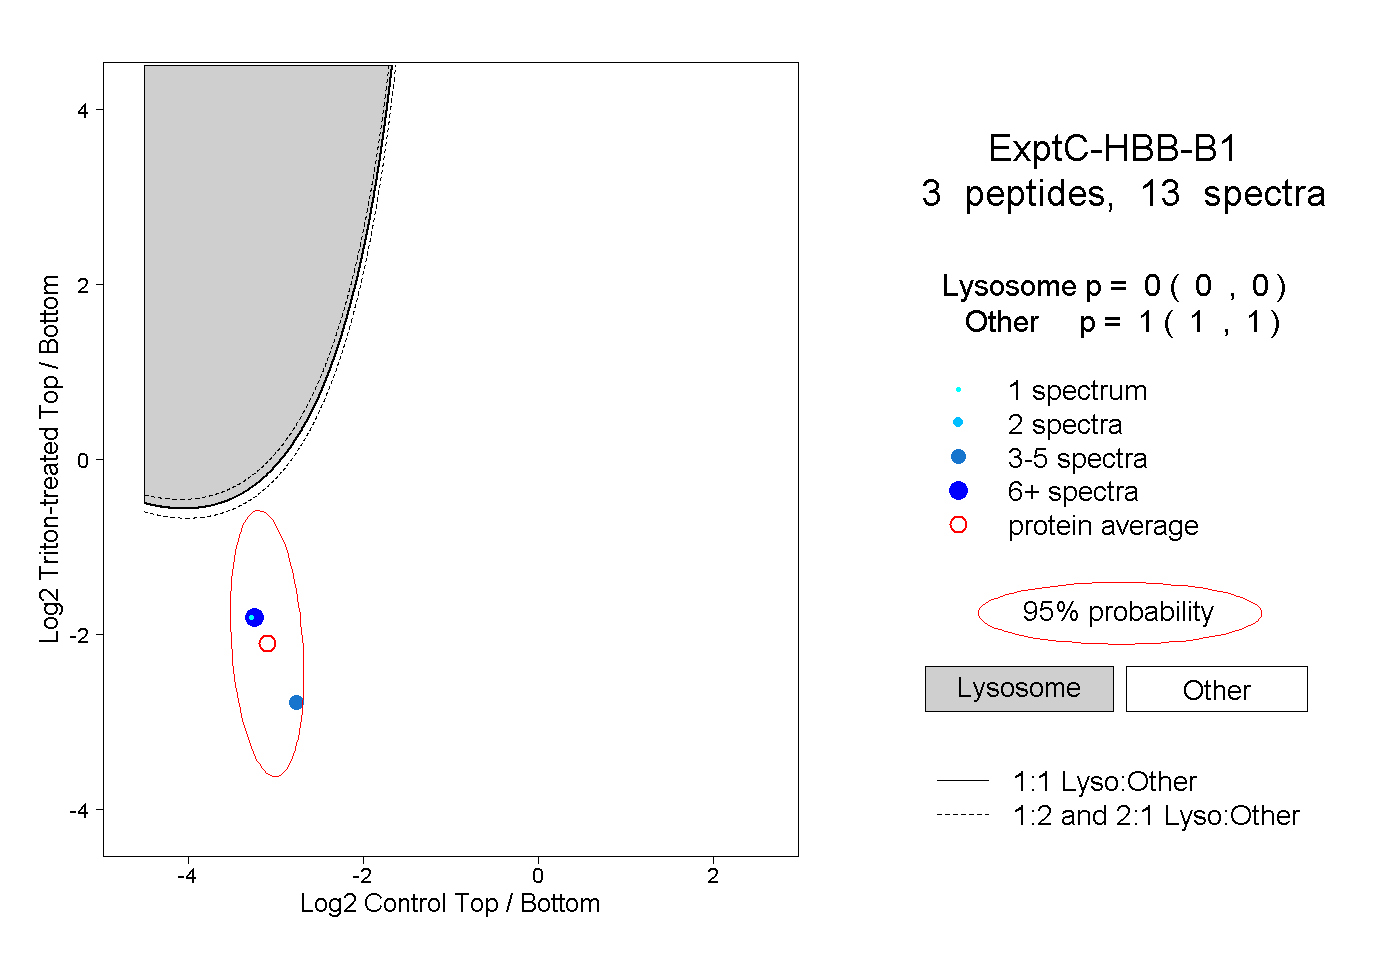 |
0.000 0.000 | 0.000 |
1.000 1.000 | 1.000 |
||||||||
| Plot | Lyso | Other | |||||||||||
| Expt D |
2 peptides |
8 spectra |
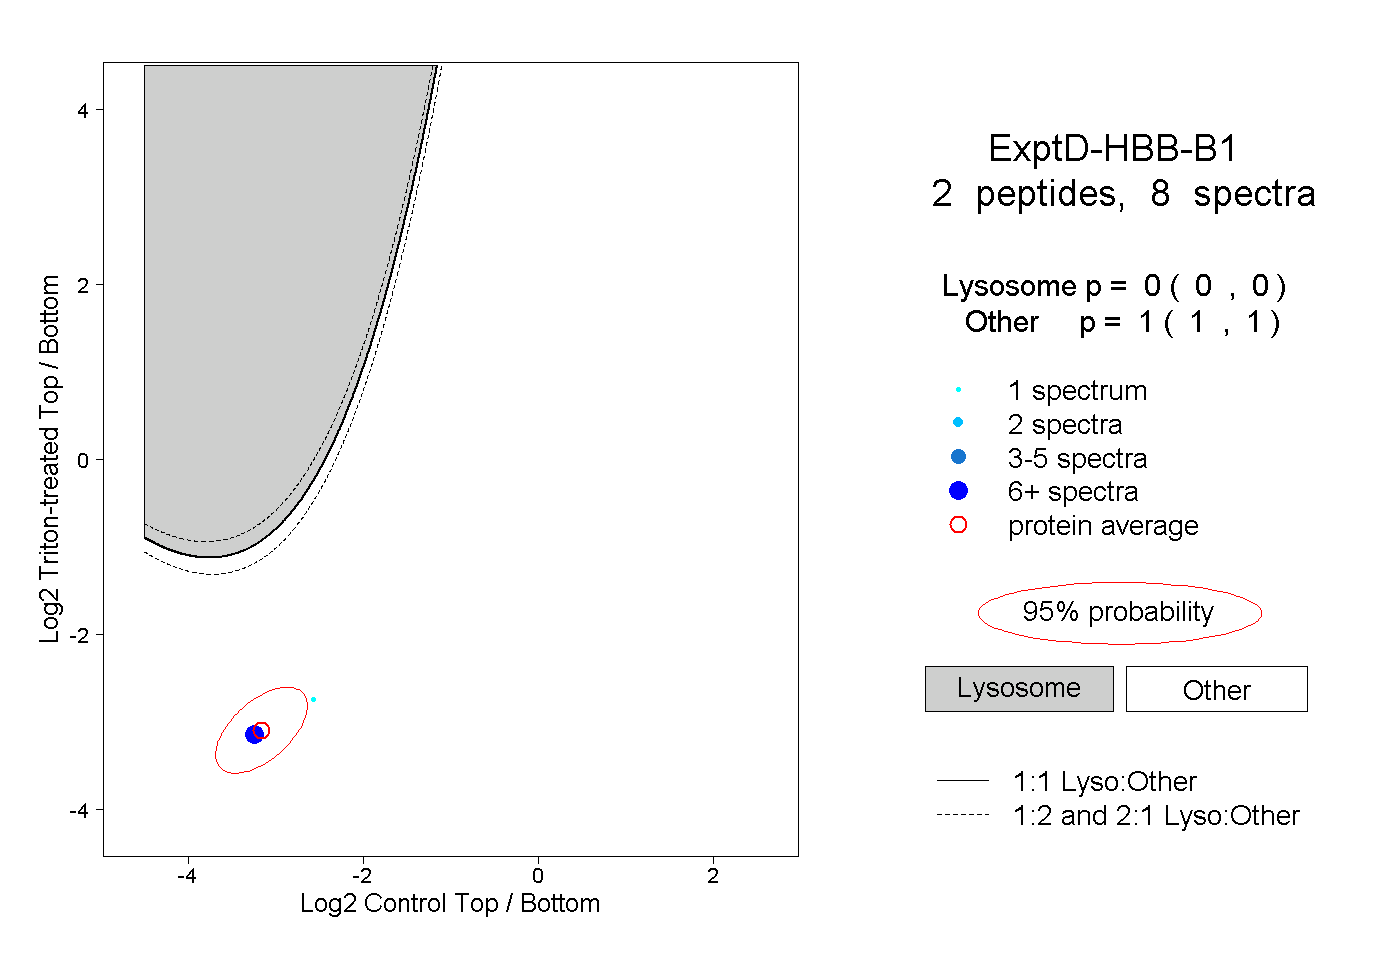 |
0.000 0.000 | 0.000 |
1.000 1.000 | 1.000 |