 19
19peptides
spectra
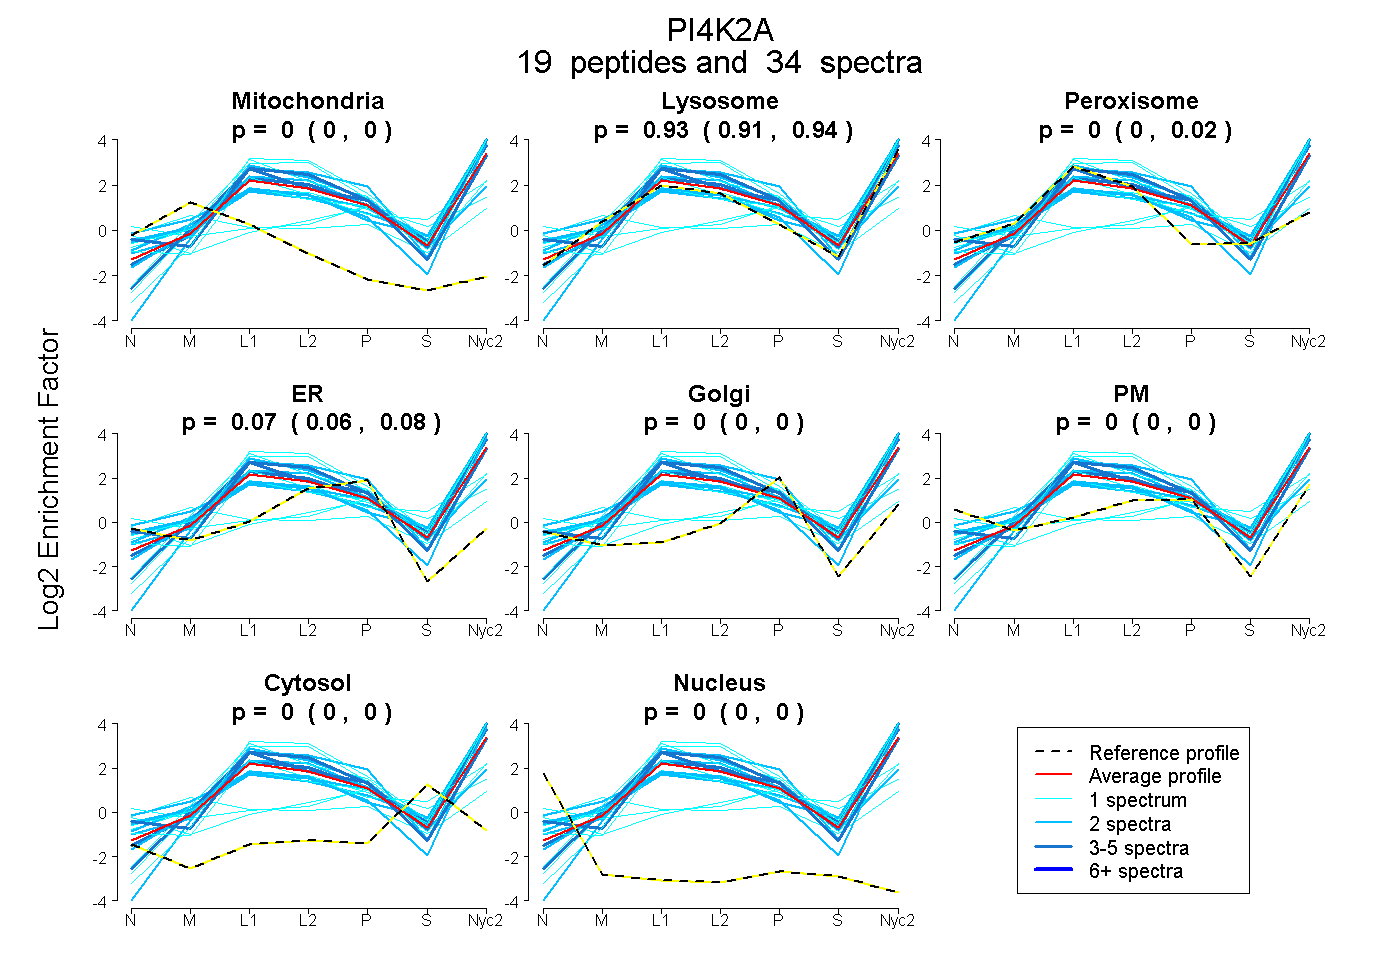
0.000 | 0.000
0.907 | 0.939
0.000 | 0.017
0.058 | 0.080
0.000 | 0.000
0.000 | 0.000
0.000 | 0.000
0.000 | 0.000
6peptides
spectra
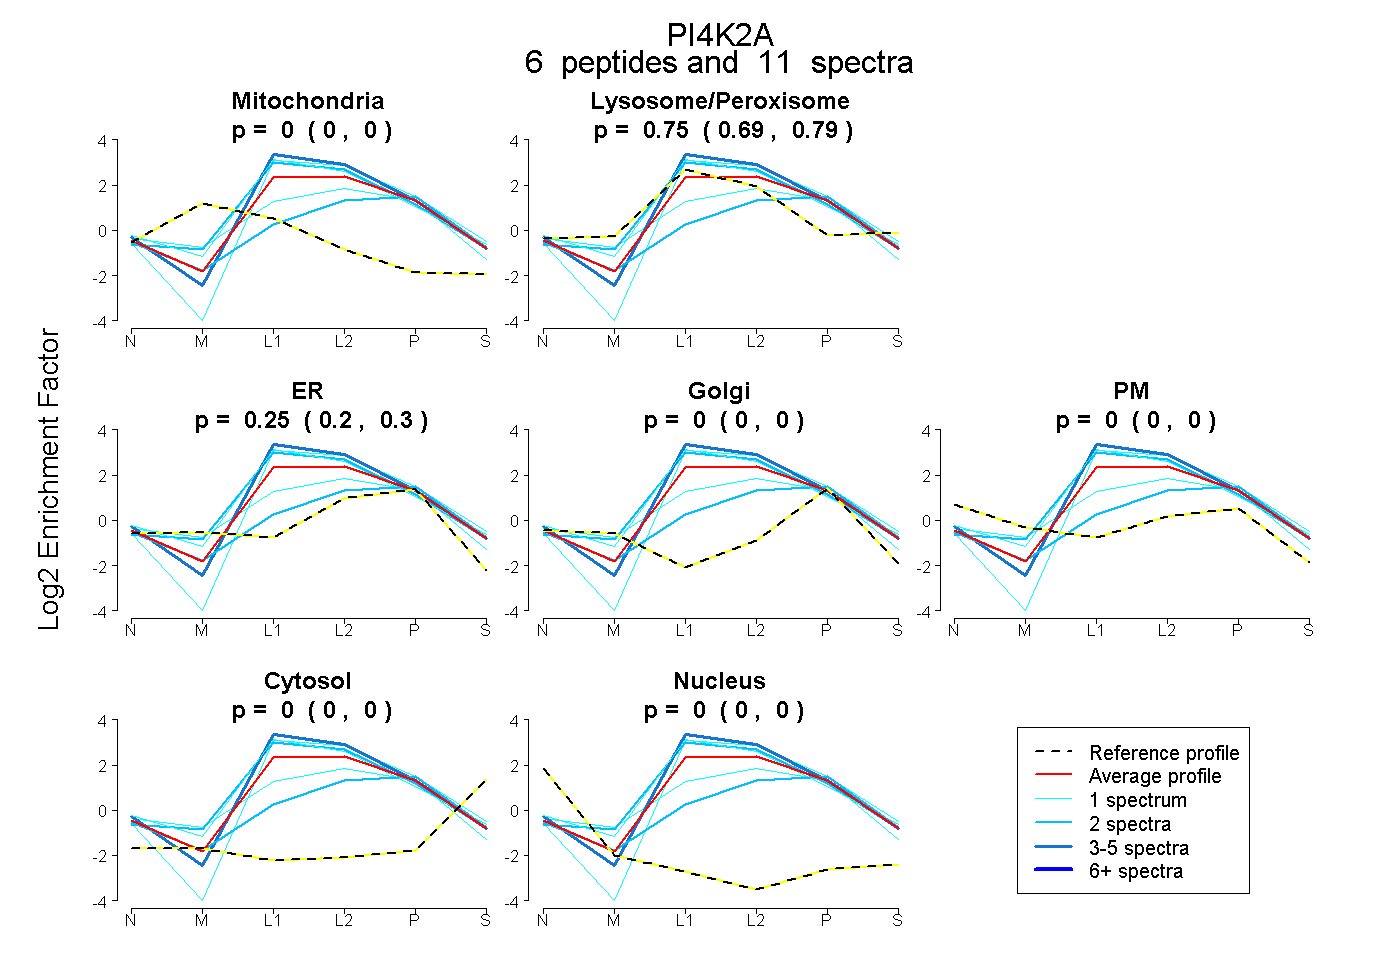
0.000 | 0.000
0.693 | 0.794
0.199 | 0.299
0.000 | 0.000
0.000 | 0.000
0.000 | 0.000
0.000 | 0.000
26peptides
spectra
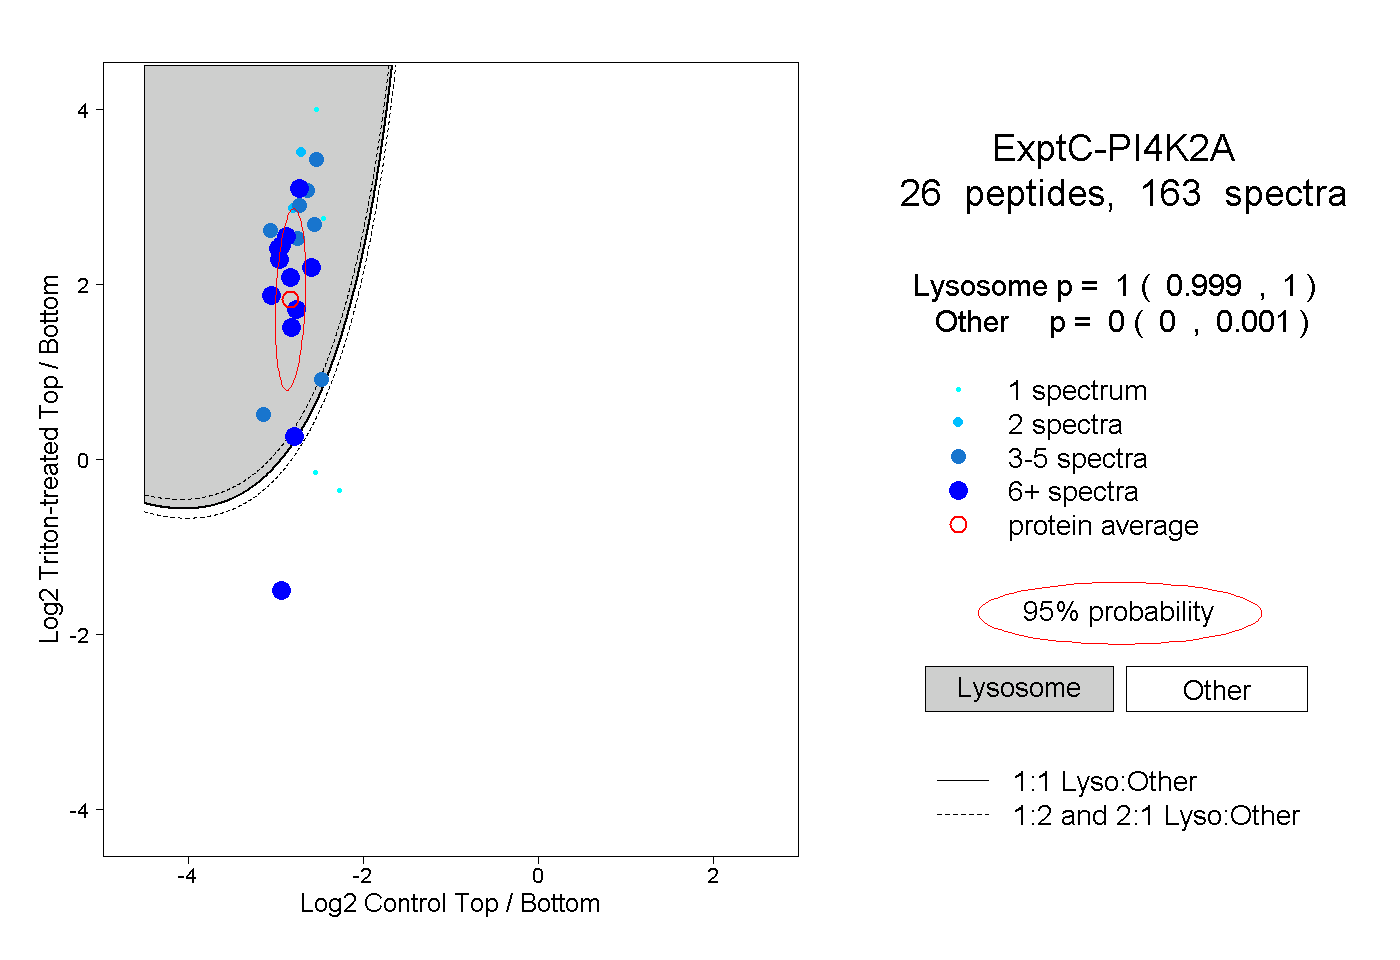
0.999 | 1.000
0.000 | 0.001
8peptides
spectra
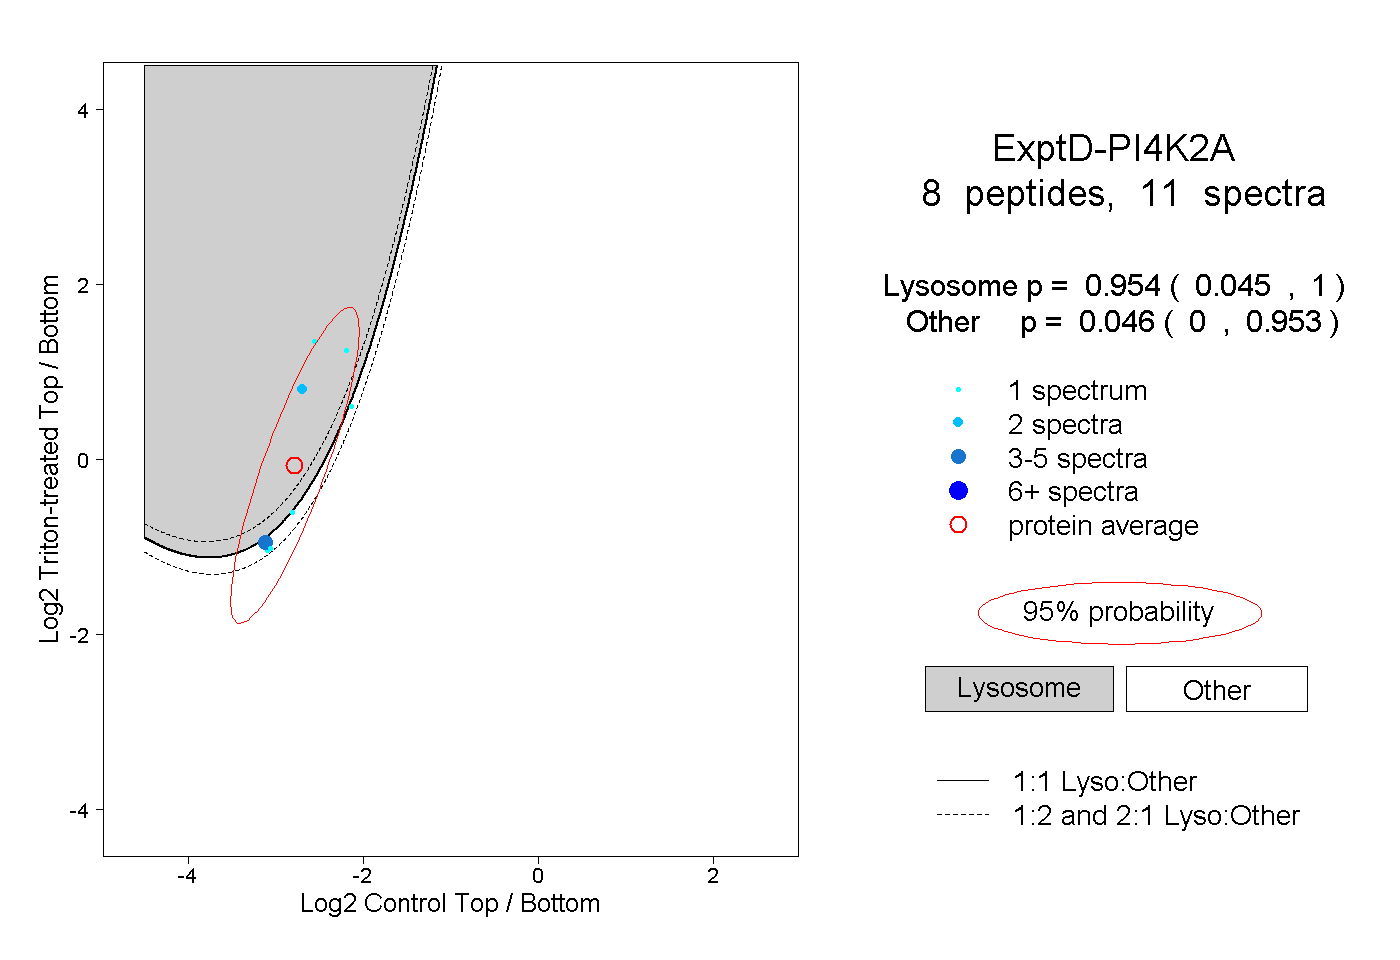
0.045 | 1.000
0.000 | 0.953