PI4K2A
[ENSRNOP00000019874]
Main page
| | | Plot |
Mito |
Lyso |
|
Perox |
ER |
Golgi |
PM |
Cytosol |
Nucleus |
|
| Expt A |
 19
19
peptides |
34
spectra |
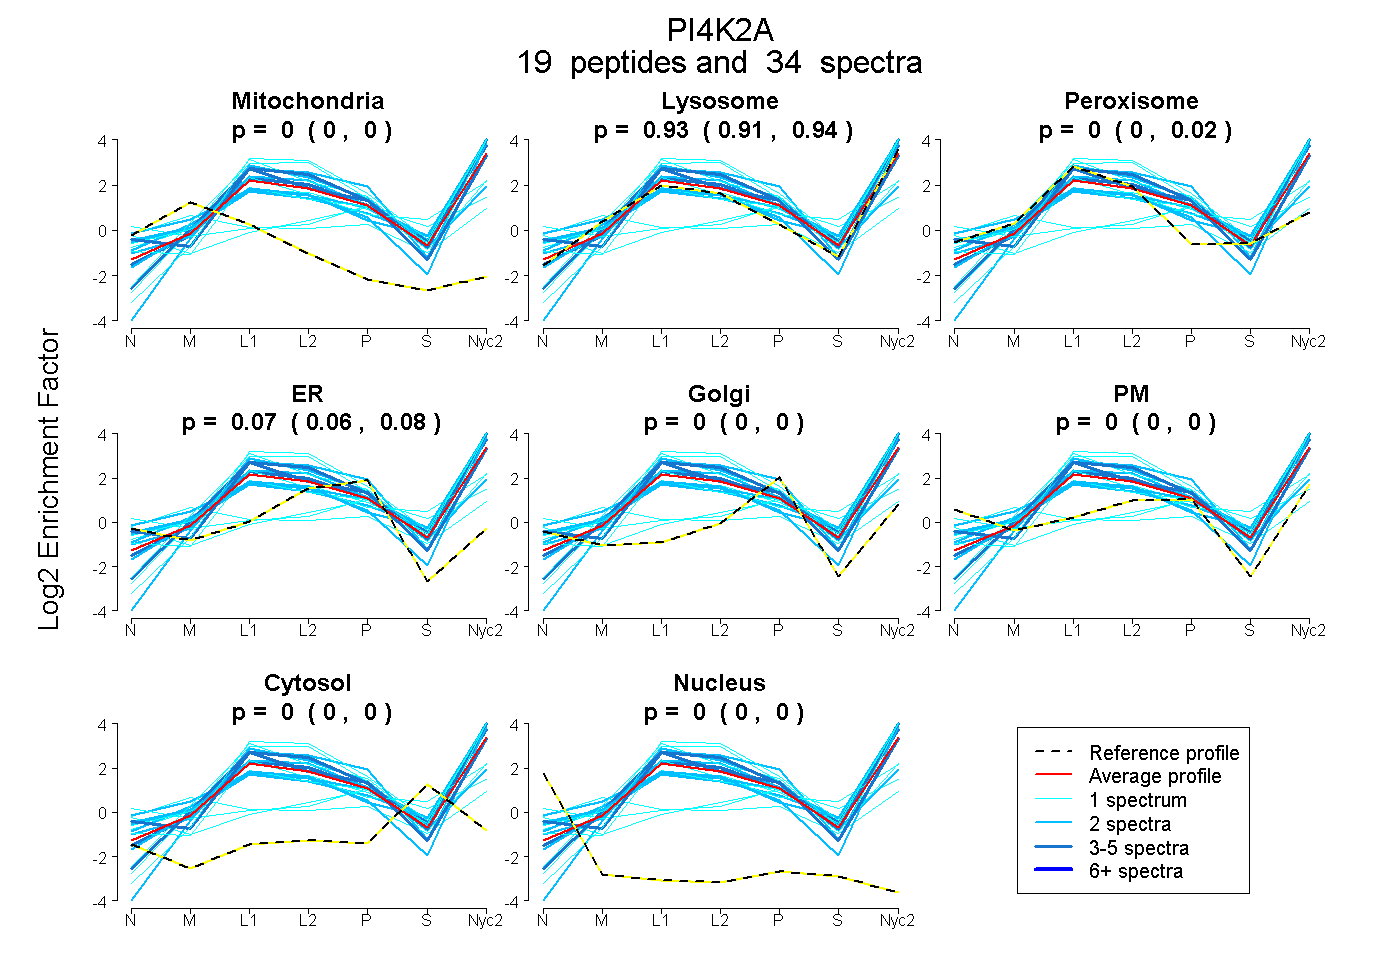 |
0.000
0.000 | 0.000 |
0.929
0.907 | 0.939 |
|
0.000
0.000 | 0.017 |
0.071
0.058 | 0.080 |
0.000
0.000 | 0.000 |
0.000
0.000 | 0.000 |
0.000
0.000 | 0.000 |
0.000
0.000 | 0.000 |
|
| | | Plot |
Mito |
|
Lyso or Perox |
|
ER |
Golgi |
PM |
Cytosol |
Nucleus |
|
| Expt B |
6
peptides |
11
spectra |
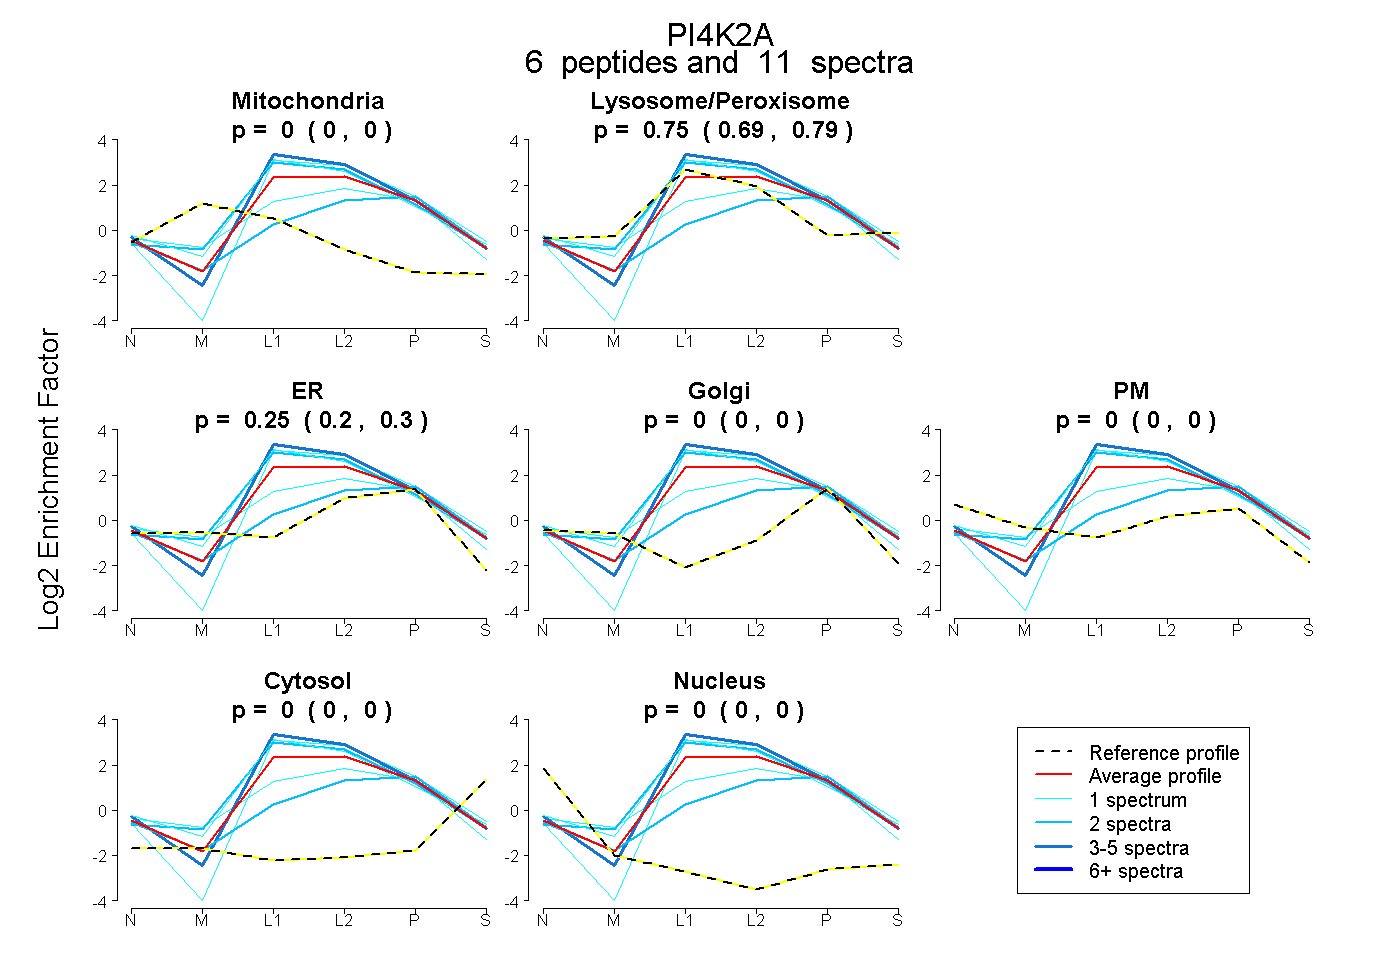 |
0.000
0.000 | 0.000 |
|
0.745
0.693 | 0.794 |
|
0.255
0.199 | 0.299 |
0.000
0.000 | 0.000 |
0.000
0.000 | 0.000 |
0.000
0.000 | 0.000 |
0.000
0.000 | 0.000 |
|
| 1 spectrum, QLLLQFER |
0.000 |
|
0.938 |
|
0.062 |
0.000 |
0.000 |
0.000 |
0.000 |
|
| 2 spectra, QPLLDR |
0.000 |
|
0.309 |
|
0.624 |
0.000 |
0.000 |
0.067 |
0.000 |
|
| 4 spectra, LVVLDYIIR |
0.000 |
|
0.940 |
|
0.060 |
0.000 |
0.000 |
0.000 |
0.000 |
|
| 1 spectrum, GQILNLTQALK |
0.000 |
|
0.490 |
|
0.510 |
0.000 |
0.000 |
0.000 |
0.000 |
|
| 1 spectrum, DLEEDLYELFK |
0.000 |
|
0.885 |
|
0.115 |
0.000 |
0.000 |
0.000 |
0.000 |
|
| 2 spectra, LELNIVPR |
0.000 |
|
0.893 |
|
0.107 |
0.000 |
0.000 |
0.000 |
0.000 |
|
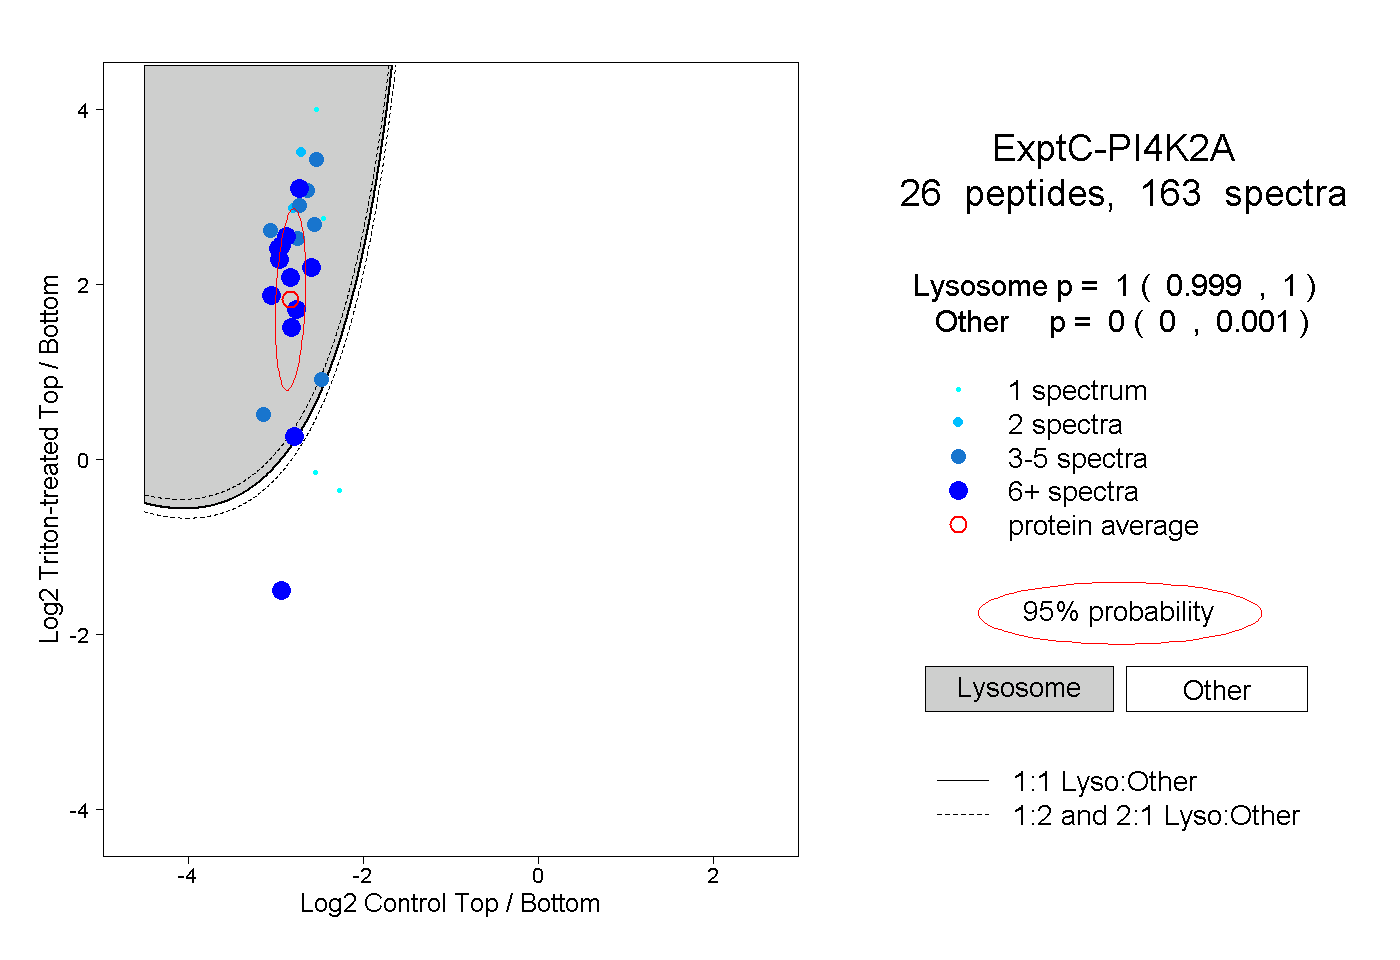
| | | Plot |
|
Lyso |
|
|
|
|
|
|
|
Other |
| Expt C |
26
peptides |
163
spectra |
 |
|
1.000
0.999 | 1.000 |
|
|
|
|
|
|
|
0.000
0.000 | 0.001 |
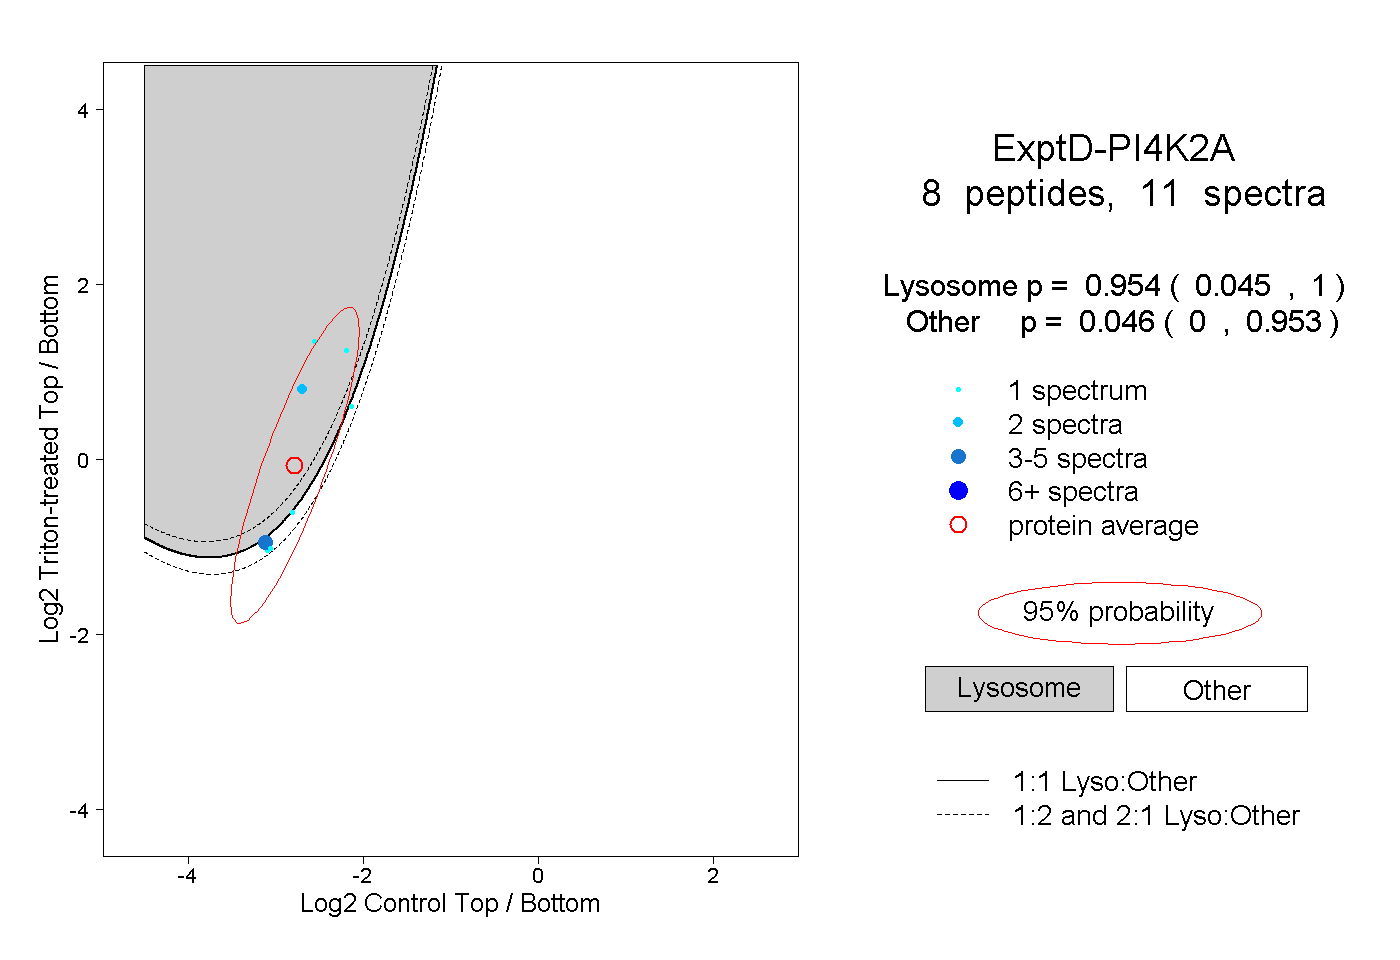
| | | Plot |
|
Lyso |
|
|
|
|
|
|
|
Other |
| Expt D |
8
peptides |
11
spectra |
 |
|
0.954
0.045 | 1.000 |
|
|
|
|
|
|
|
0.046
0.000 | 0.953 |