 8
8peptides
spectra
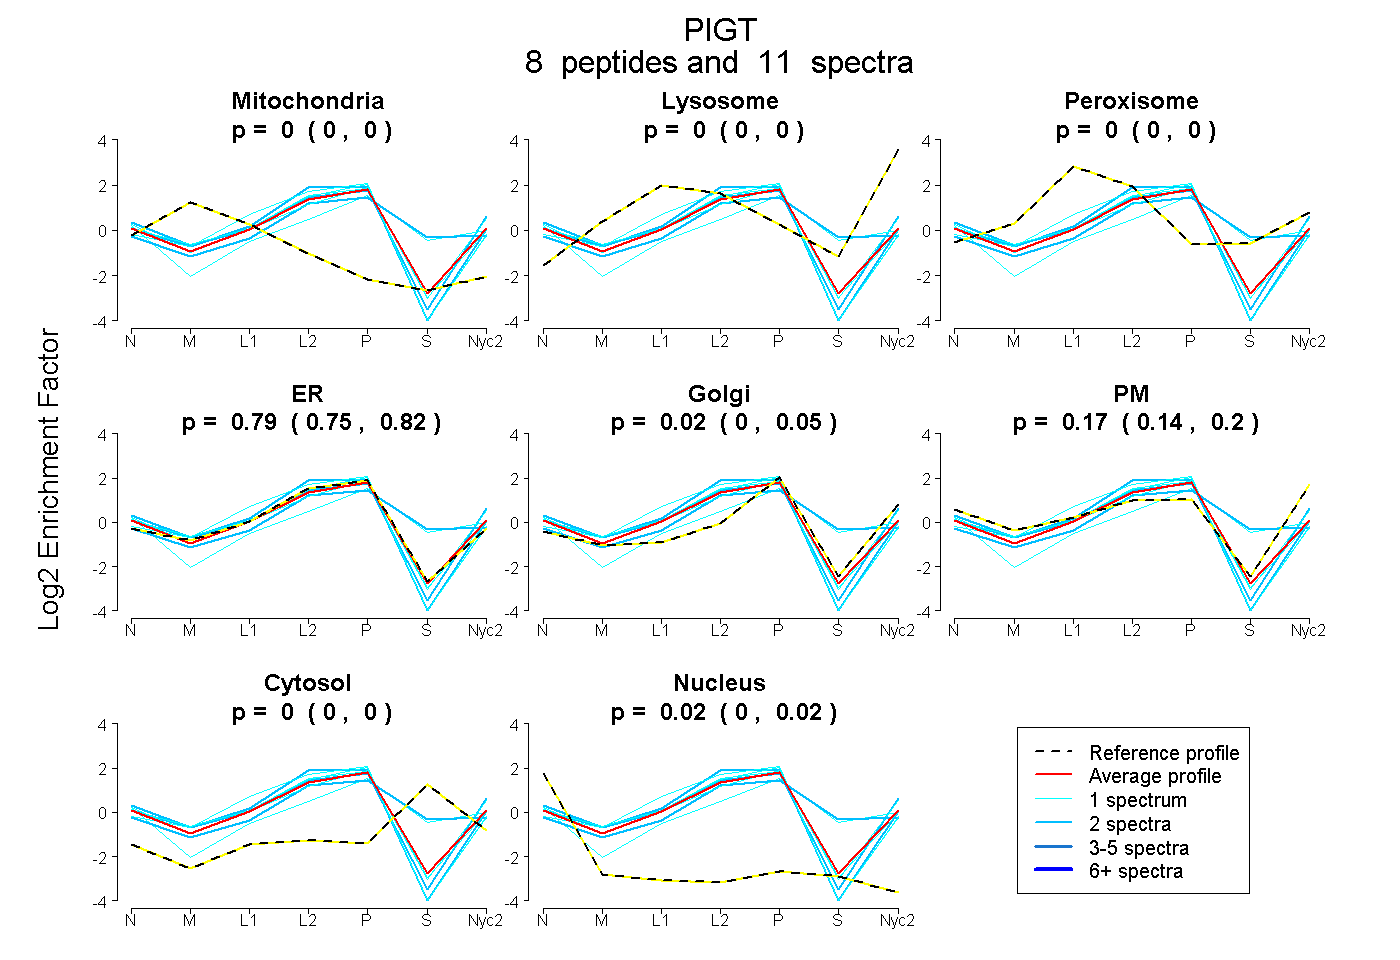
0.000 | 0.000
0.000 | 0.000
0.000 | 0.000
0.745 | 0.823
0.000 | 0.054
0.143 | 0.196
0.000 | 0.003
0.005 | 0.022
8peptides
spectra
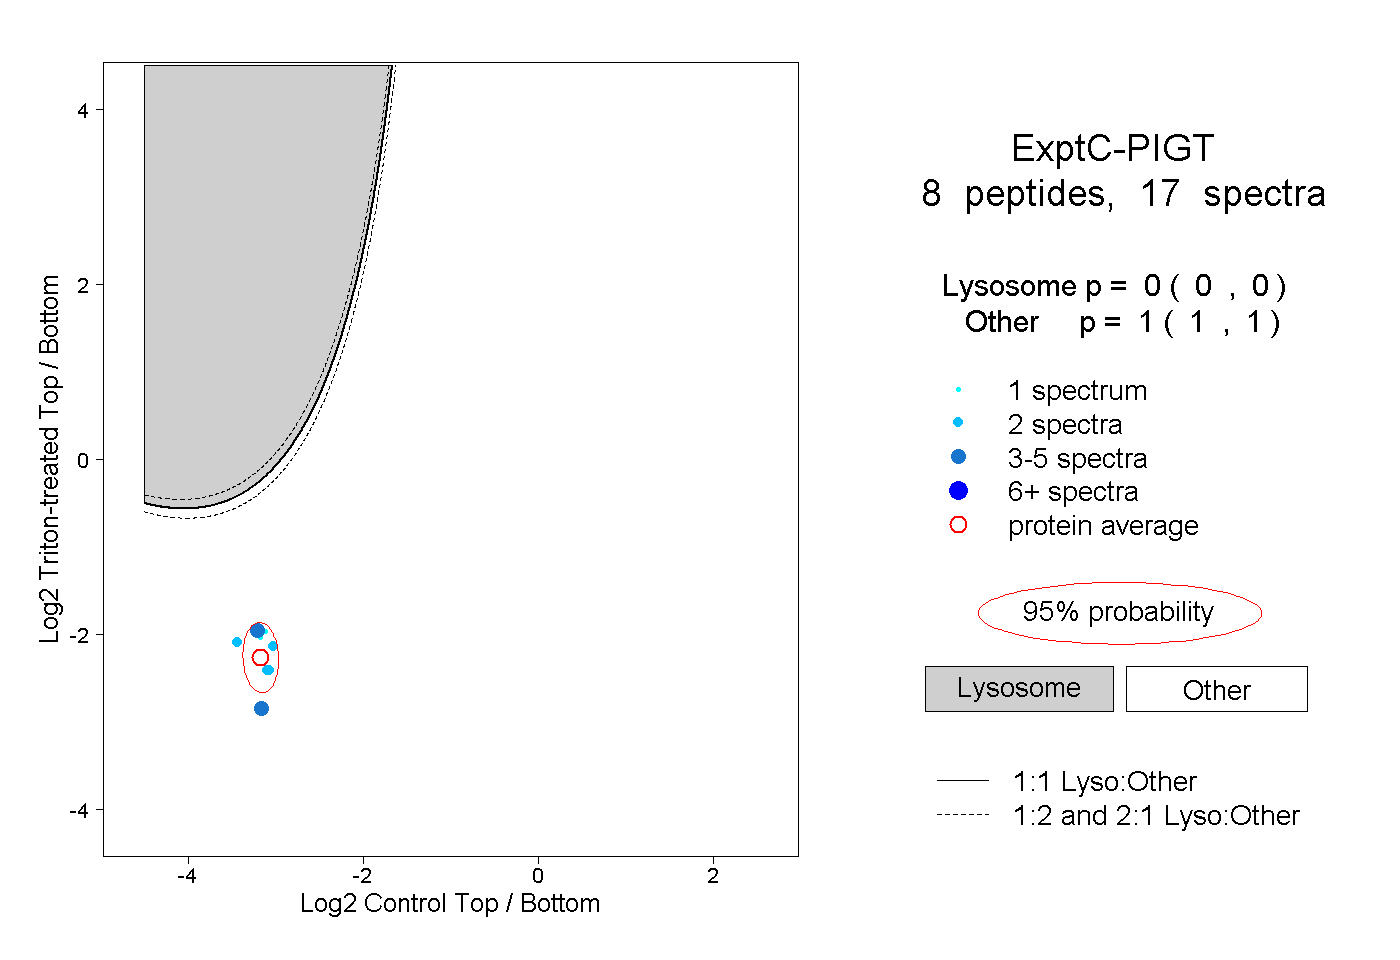
0.000 | 0.000
1.000 | 1.000
2peptides
spectra
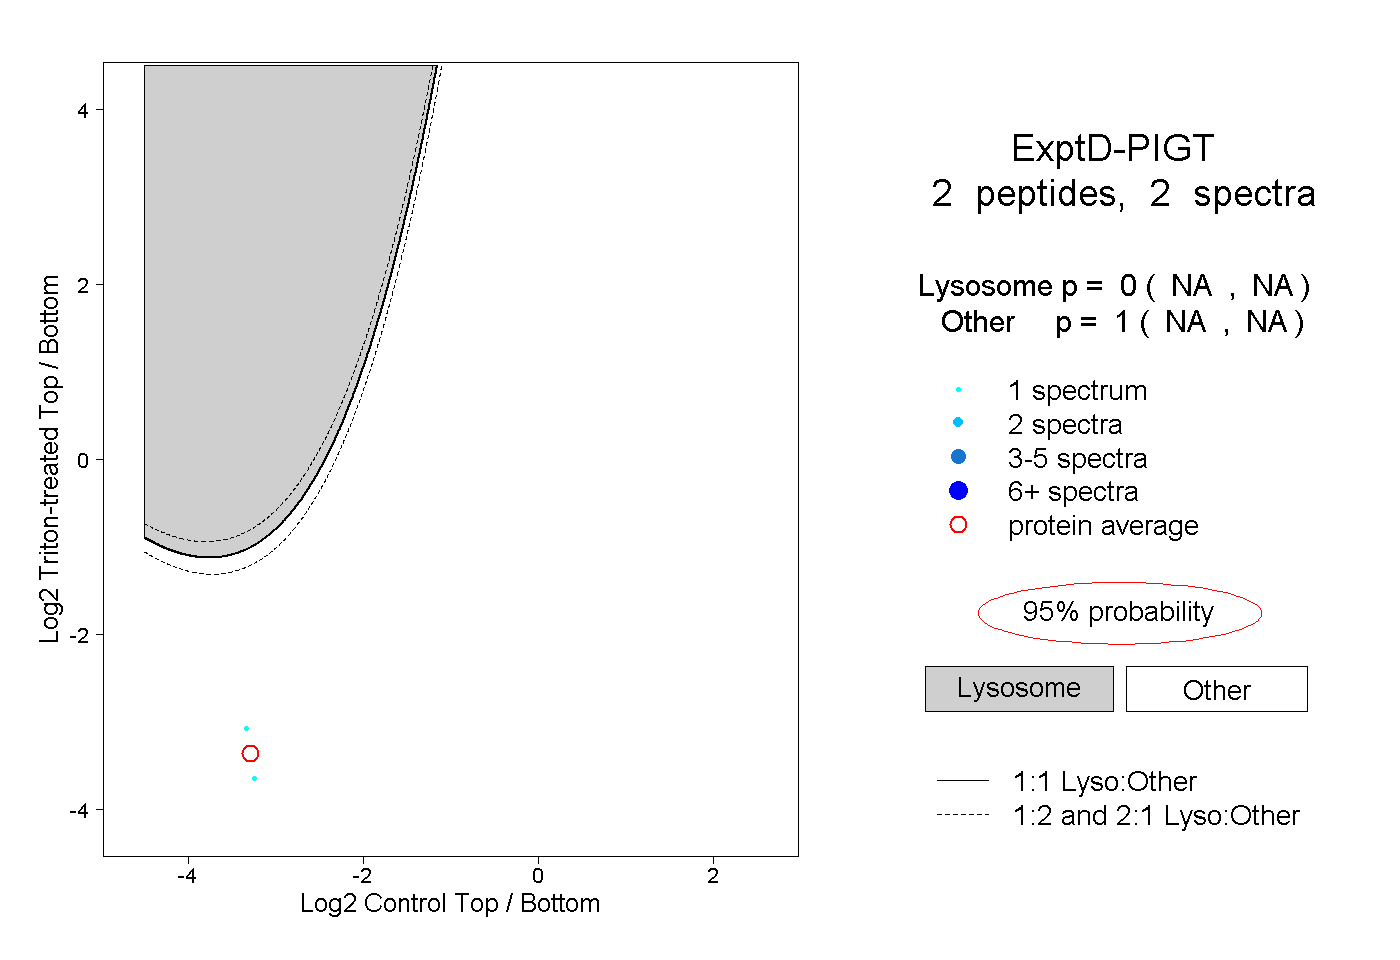
NA | NA
NA | NA