 8
8peptides
spectra
0.000 | 0.000
0.000 | 0.000
0.000 | 0.000
0.745 | 0.823
0.000 | 0.054
0.143 | 0.196
0.000 | 0.003
0.005 | 0.022
8peptides
spectra
0.000 | 0.000
1.000 | 1.000
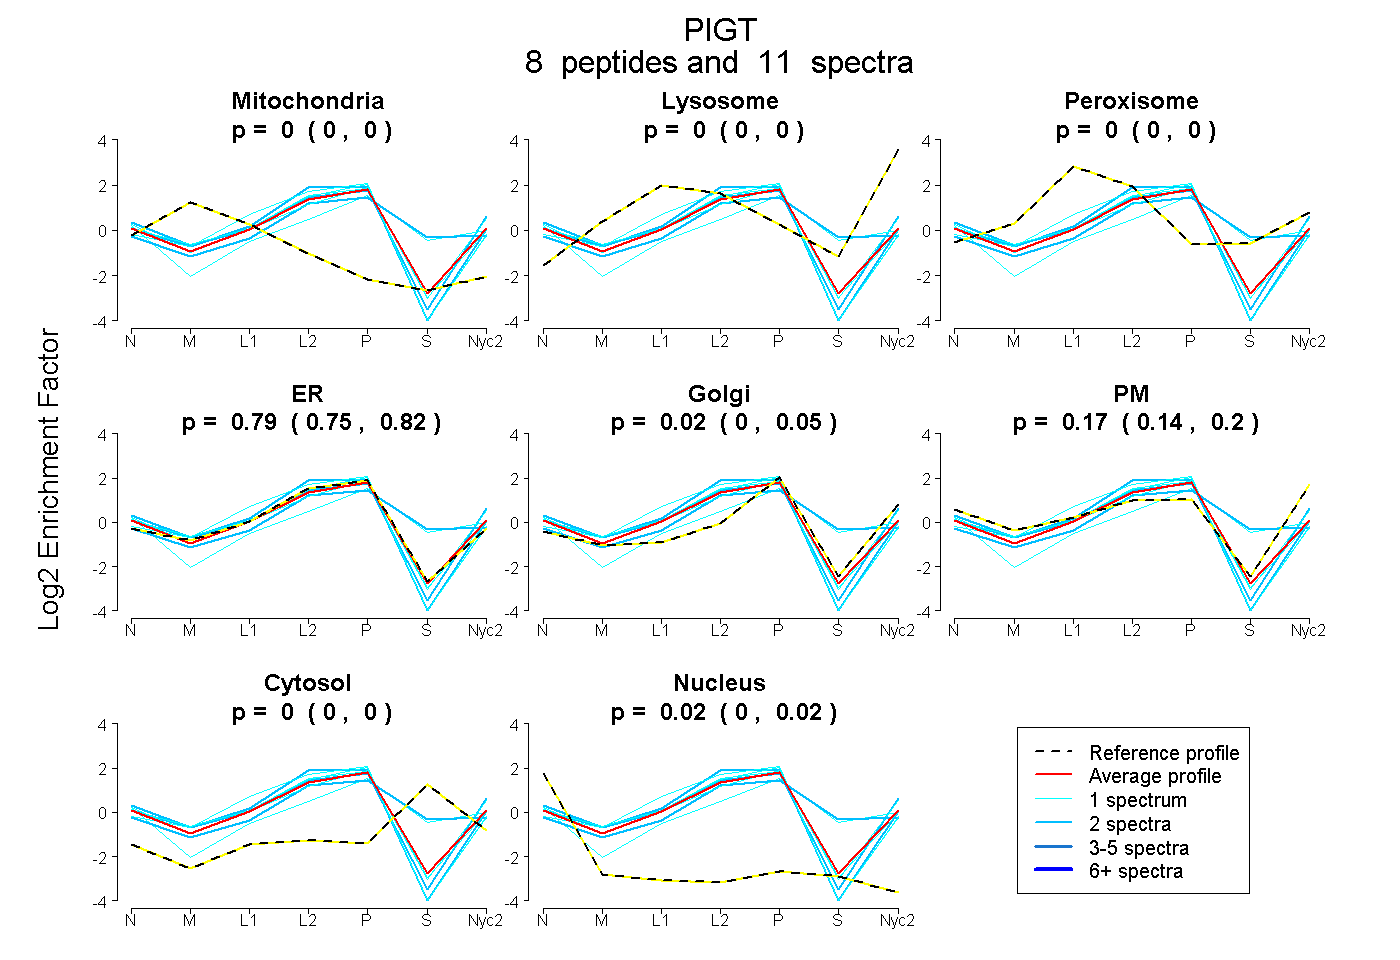
| Plot | Mito | Lyso | Perox | ER | Golgi | PM | Cytosol | Nucleus | |||||
| Expt A |
8 peptides |
11 spectra |
|
0.000 0.000 | 0.000 |
0.000 0.000 | 0.000 |
0.000 0.000 | 0.000 |
0.793 0.745 | 0.823 |
0.018 0.000 | 0.054 |
0.173 0.143 | 0.196 |
0.000 0.000 | 0.003 |
0.015 0.005 | 0.022 |
||
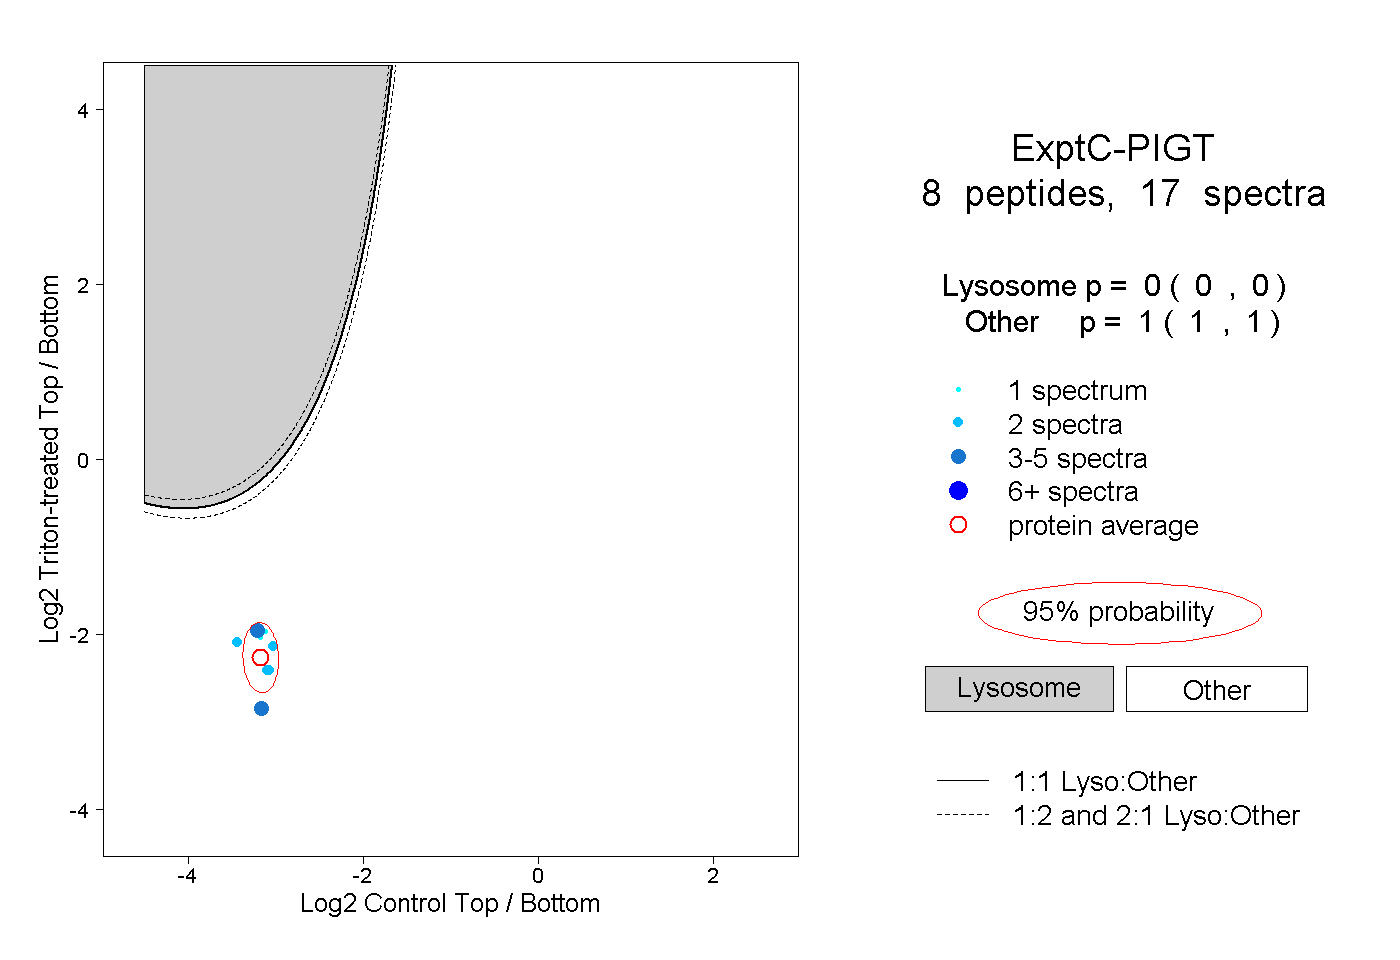
| Plot | Lyso | Other | |||||||||||
| Expt C |
8 peptides |
17 spectra |
|
0.000 0.000 | 0.000 |
1.000 1.000 | 1.000 |
| 2 spectra, VSIQFER | 0.000 | 1.000 | ||||||||
| 2 spectra, GELSTLLYNSHPYR | 0.000 | 1.000 | ||||||||
| 1 spectrum, EGVSHYR | 0.000 | 1.000 | ||||||||
| 3 spectra, TFHIEEPK | 0.000 | 1.000 | ||||||||
| 2 spectra, YVSGYGLQK | 0.000 | 1.000 | ||||||||
| 1 spectrum, DWSLFR | 0.000 | 1.000 | ||||||||
| 2 spectra, LLPCSSK | 0.000 | 1.000 | ||||||||
| 4 spectra, YAVLPR | 0.000 | 1.000 |
| Plot | Lyso | Other | |||||||||||
| Expt D |
2 peptides |
2 spectra |
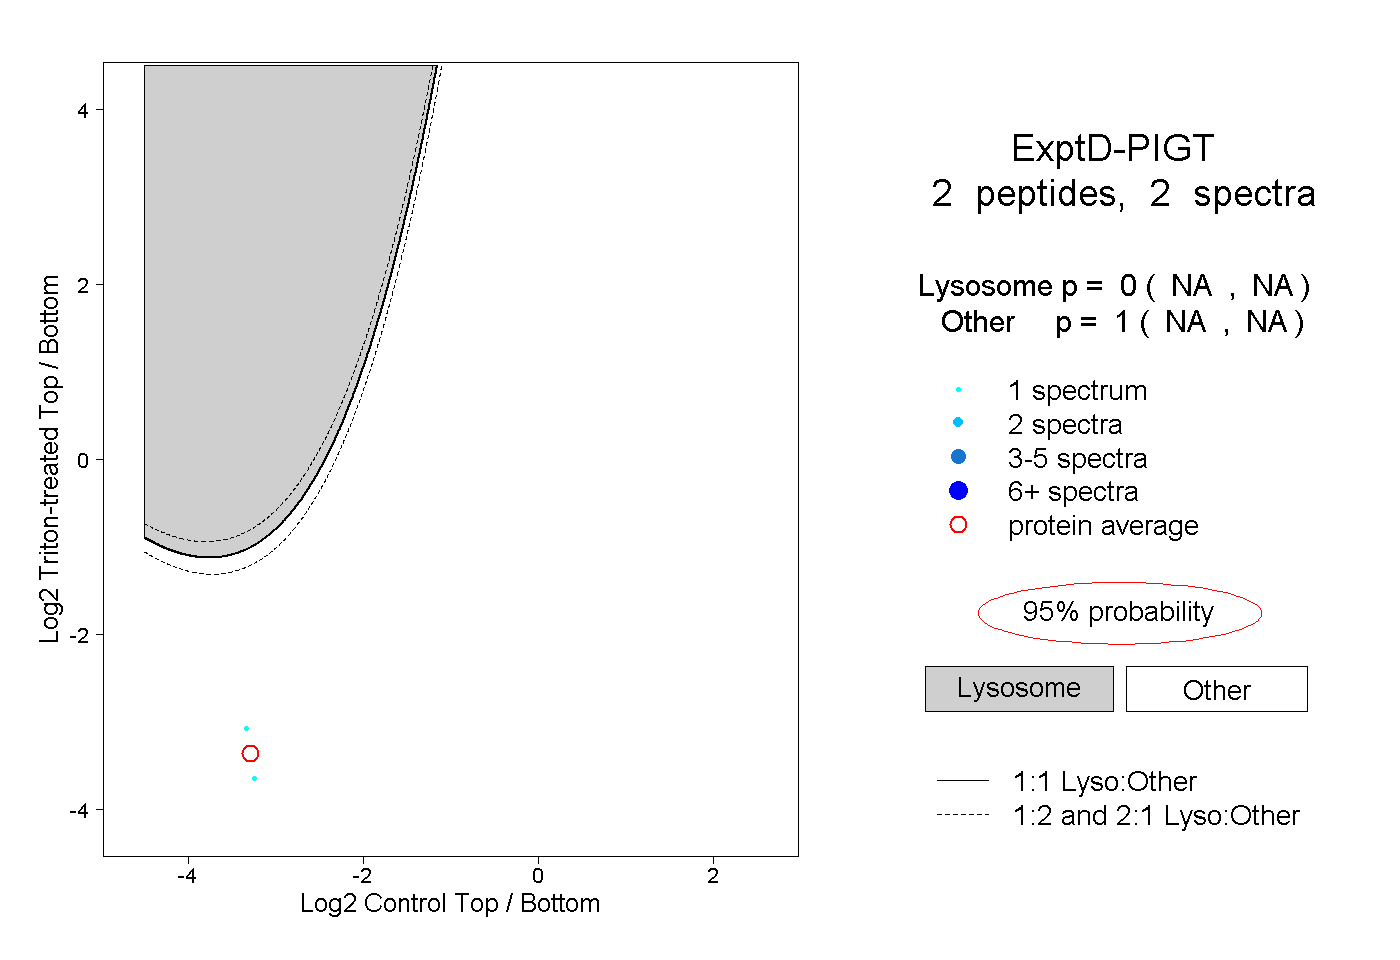 |
0.000 NA | NA |
1.000 NA | NA |