 2
2peptides
spectra
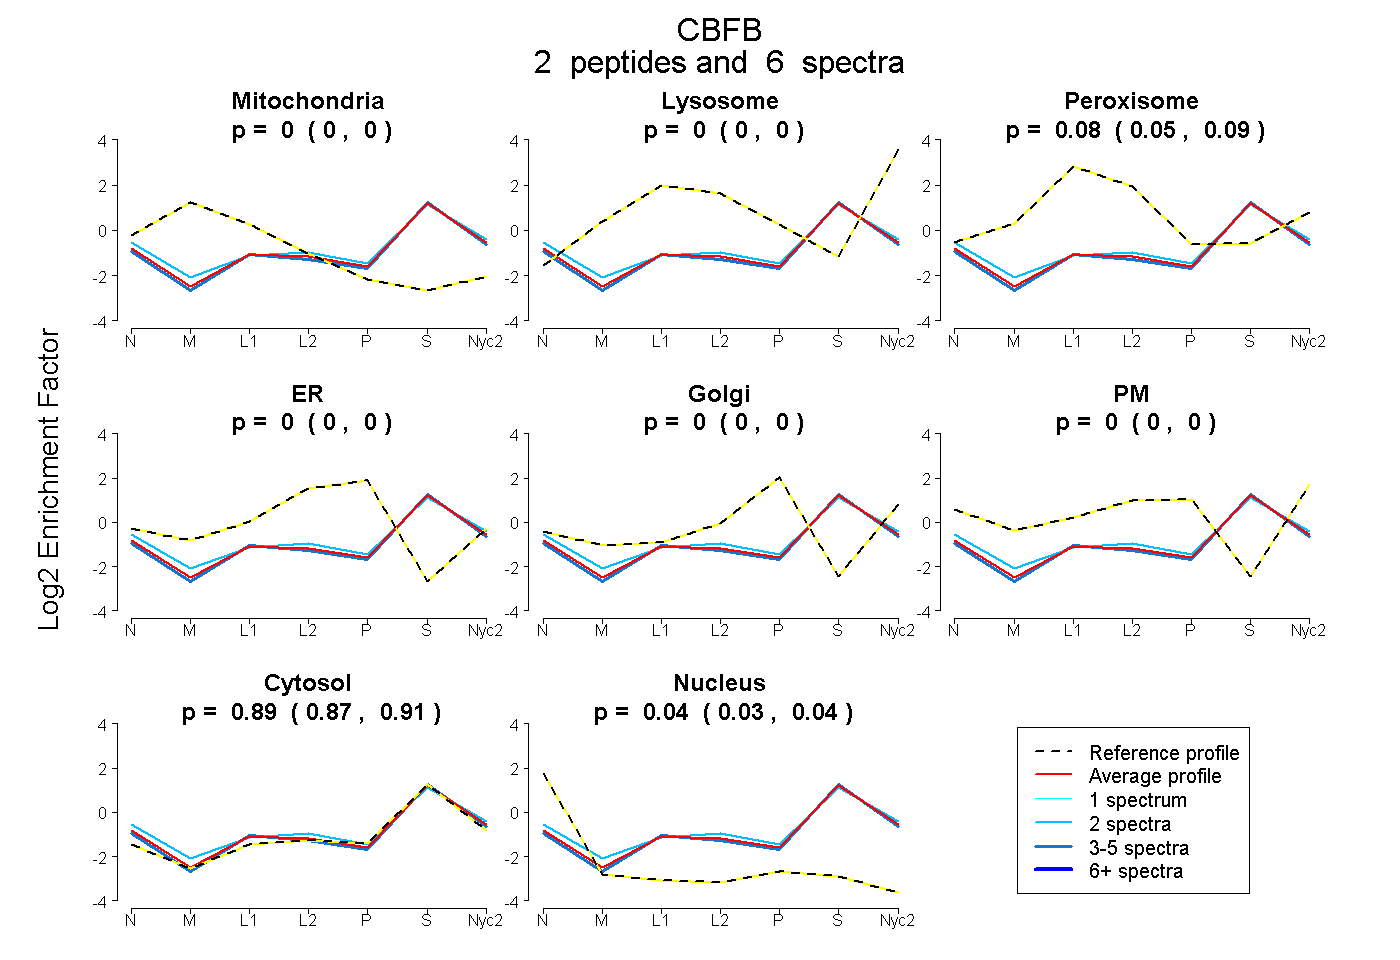
0.000 | 0.000
0.000 | 0.000
0.052 | 0.093
0.000 | 0.000
0.000 | 0.000
0.000 | 0.002
0.868 | 0.908
0.025 | 0.043
1peptide
spectra
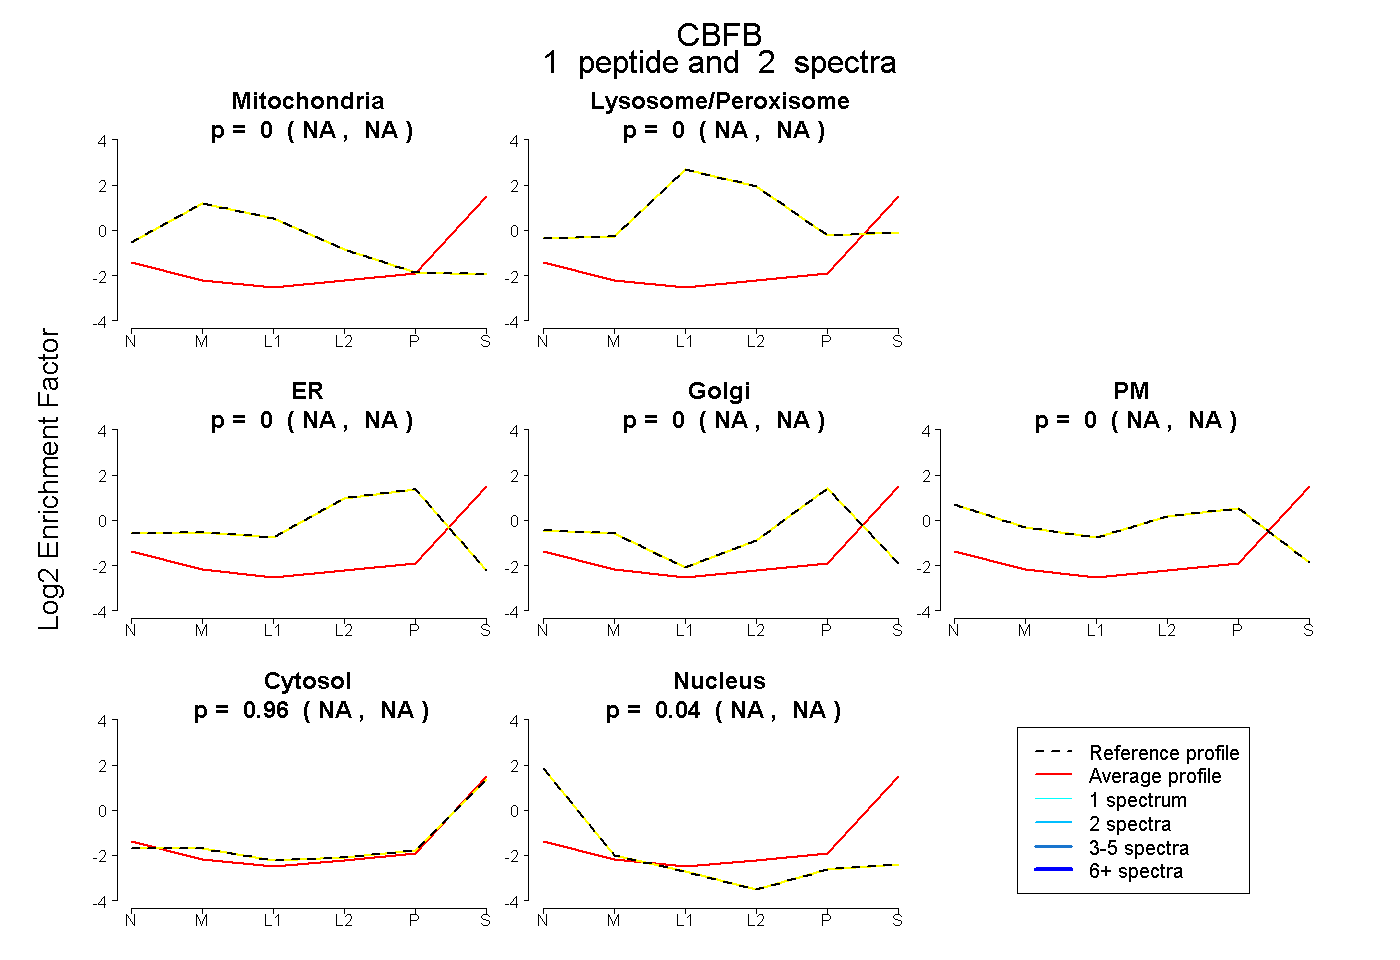
NA | NA
NA | NA
NA | NA
NA | NA
NA | NA
NA | NA
NA | NA
1peptide
spectra
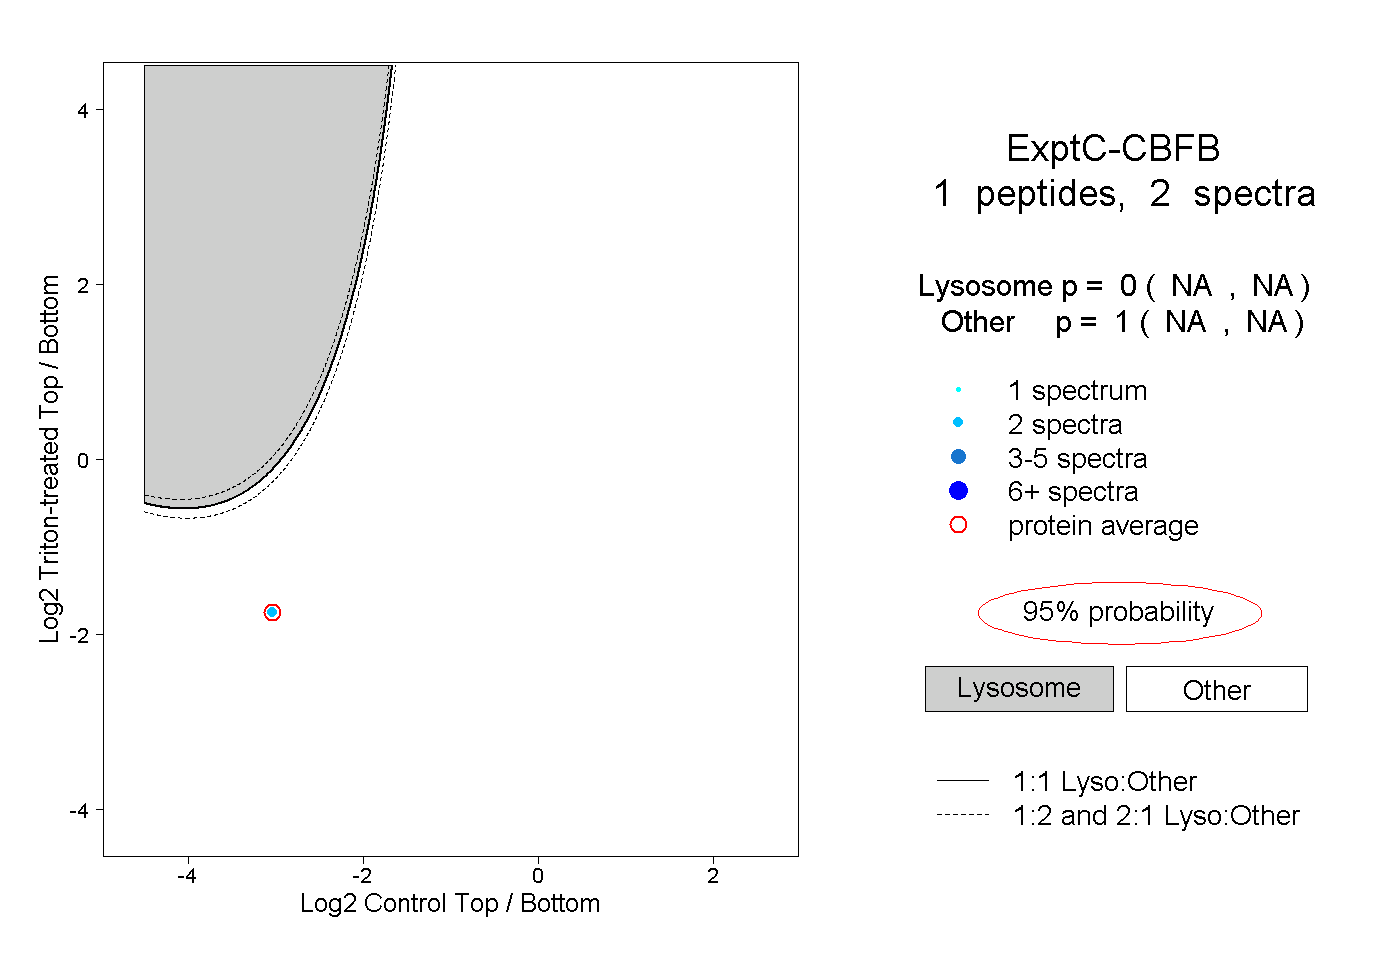
NA | NA
NA | NA