 2
2peptides
spectra
0.000 | 0.000
0.000 | 0.000
0.052 | 0.093
0.000 | 0.000
0.000 | 0.000
0.000 | 0.002
0.868 | 0.908
0.025 | 0.043
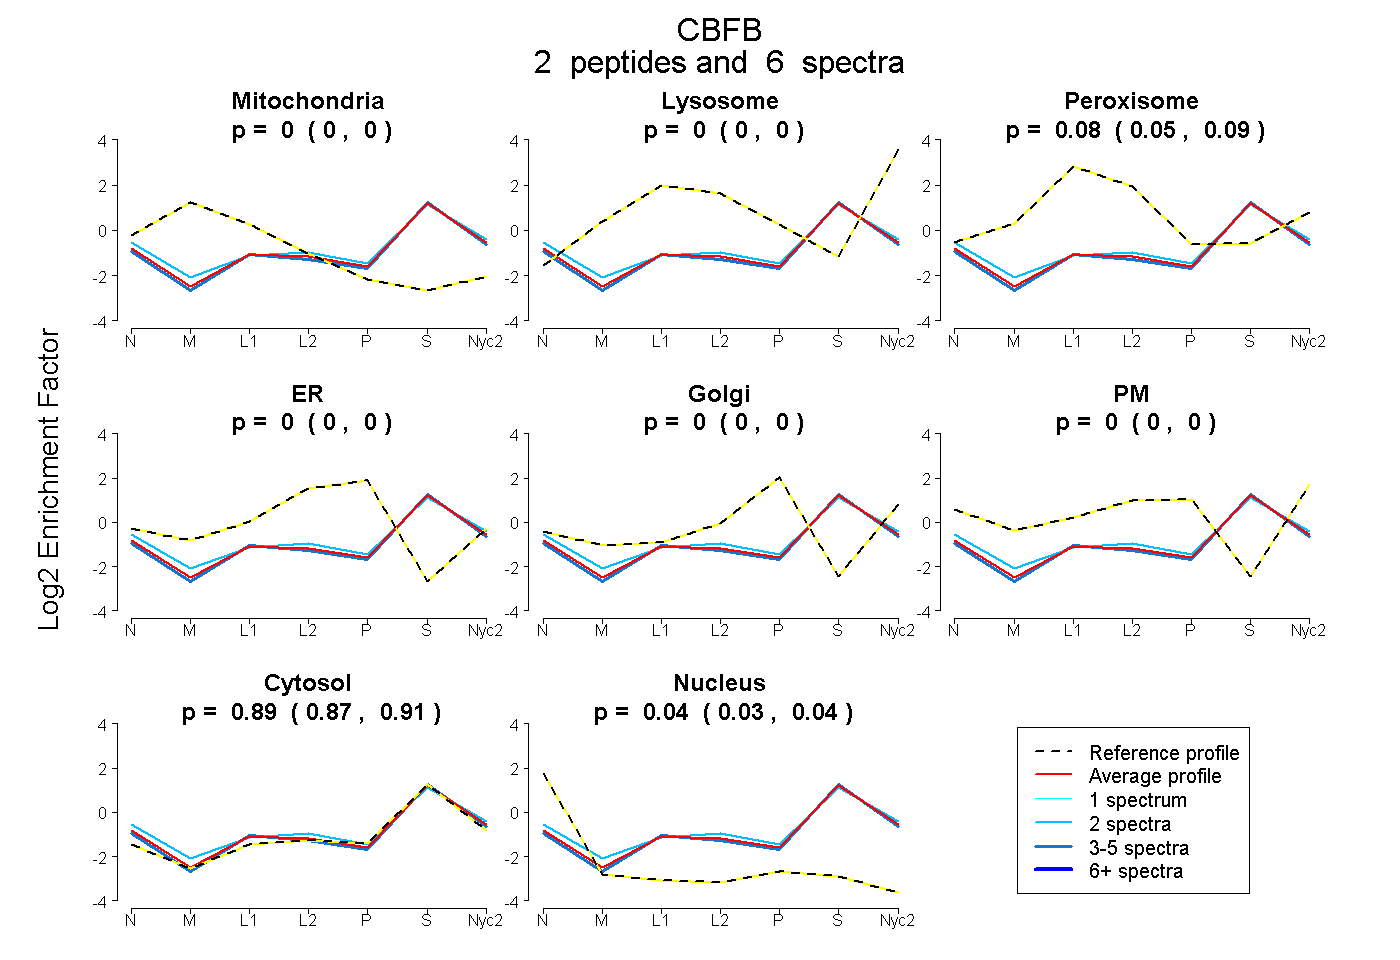
| Plot | Mito | Lyso | Perox | ER | Golgi | PM | Cytosol | Nucleus | |||||
| Expt A |
2 peptides |
6 spectra |
|
0.000 0.000 | 0.000 |
0.000 0.000 | 0.000 |
0.075 0.052 | 0.093 |
0.000 0.000 | 0.000 |
0.000 0.000 | 0.000 |
0.000 0.000 | 0.002 |
0.890 0.868 | 0.908 |
0.035 0.025 | 0.043 |
| 4 spectra, GWIDLHR | 0.000 | 0.000 | 0.047 | 0.000 | 0.000 | 0.000 | 0.927 | 0.027 | ||
| 2 spectra, VVPDQR | 0.000 | 0.000 | 0.094 | 0.000 | 0.000 | 0.045 | 0.821 | 0.040 |
| Plot | Mito | Lyso or Perox | ER | Golgi | PM | Cytosol | Nucleus | ||||||
| Expt B |
1 peptide |
2 spectra |
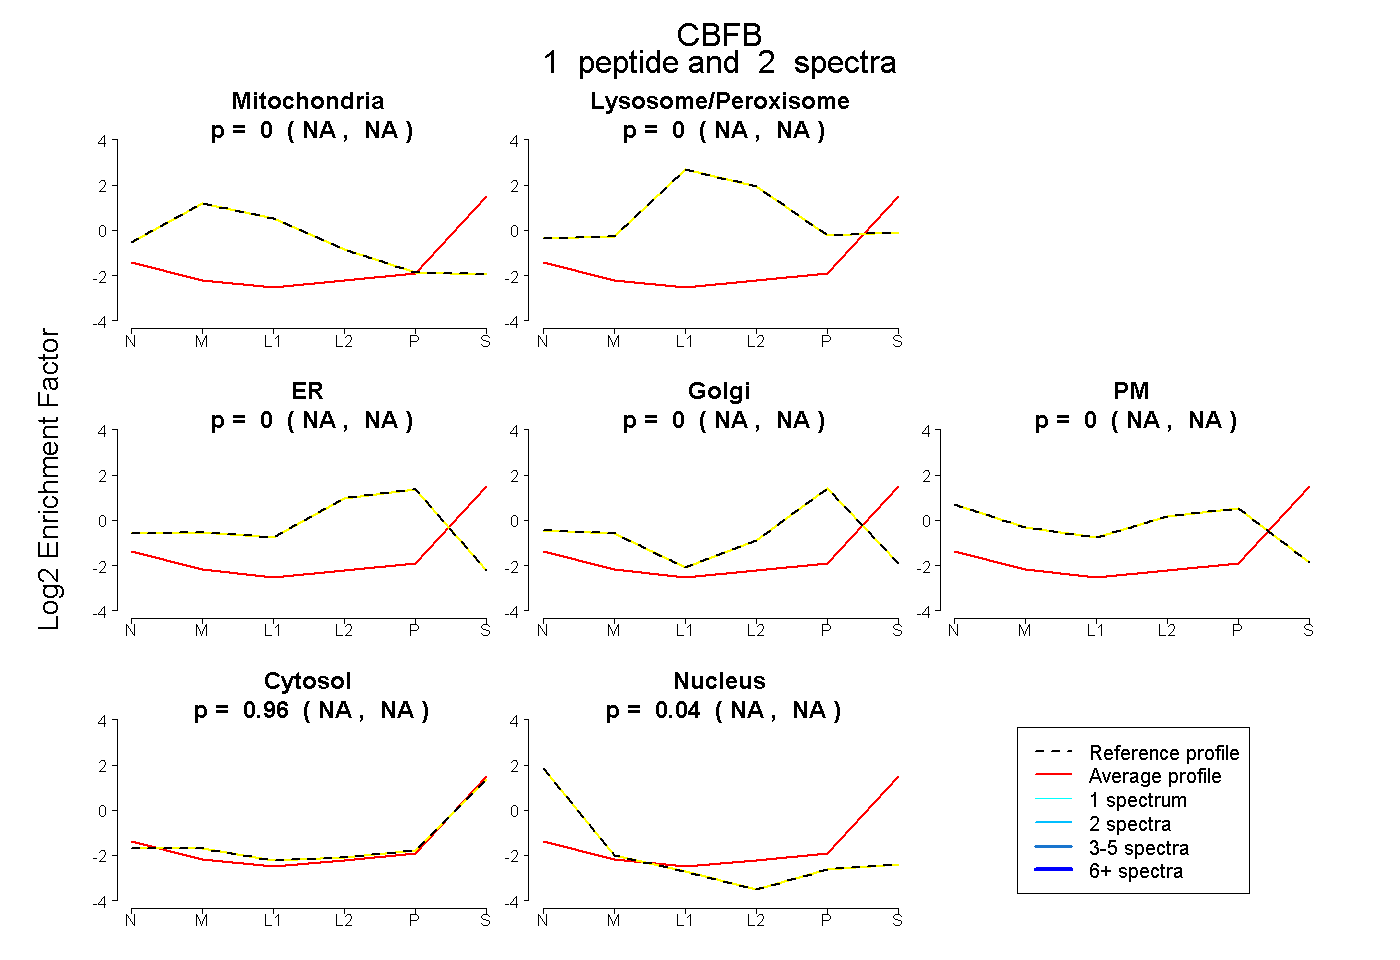 |
0.000 NA | NA |
0.000 NA | NA |
0.000 NA | NA |
0.000 NA | NA |
0.000 NA | NA |
0.960 NA | NA |
0.040 NA | NA |
|||
| Plot | Lyso | Other | |||||||||||
| Expt C |
1 peptide |
2 spectra |
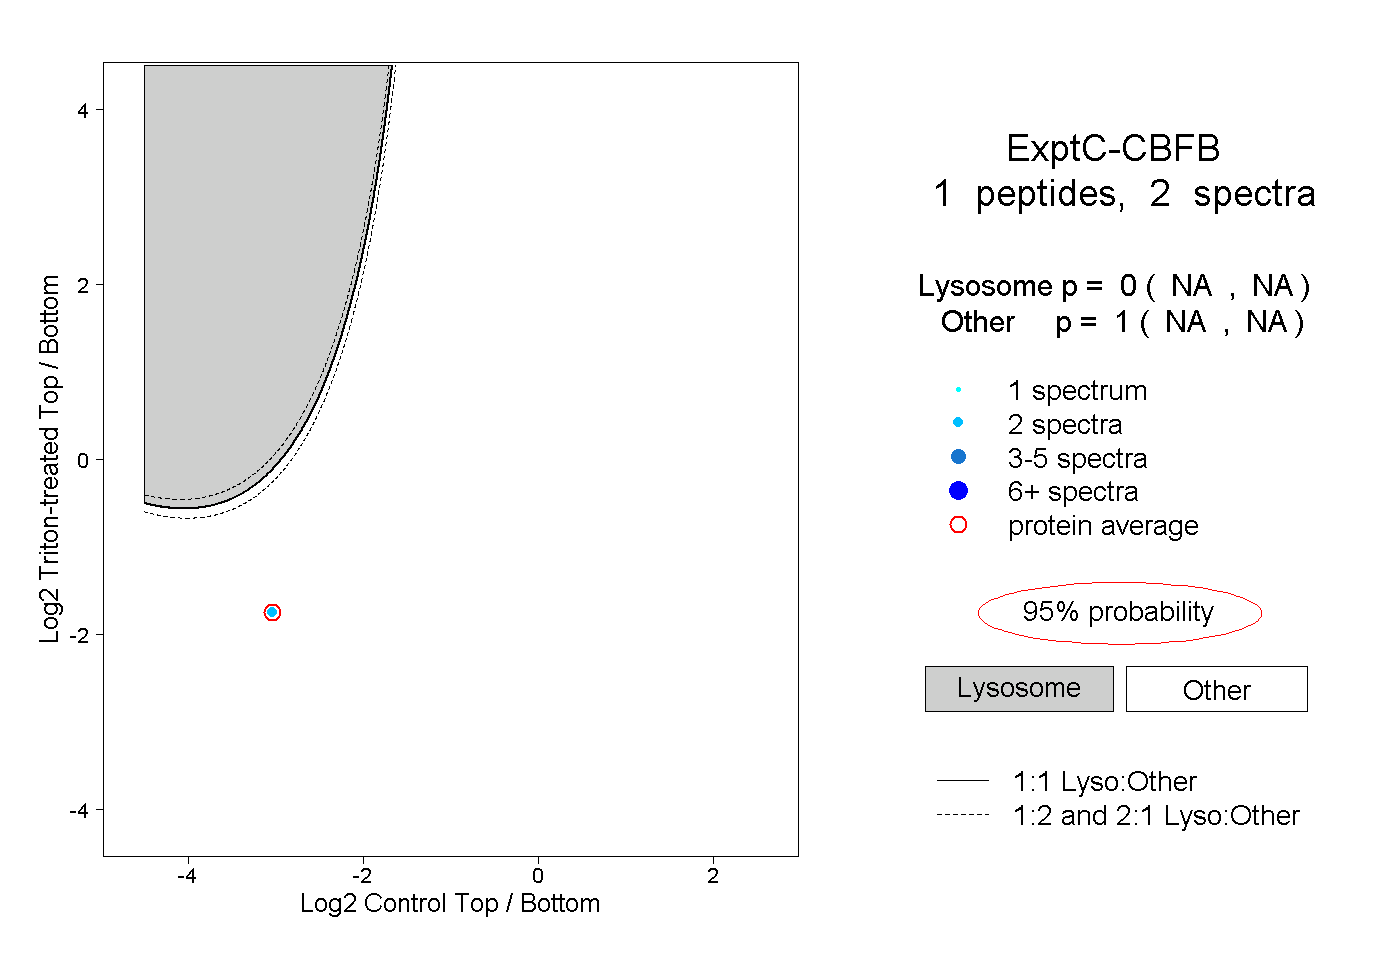 |
0.000 NA | NA |
1.000 NA | NA |