 16
16peptides
spectra
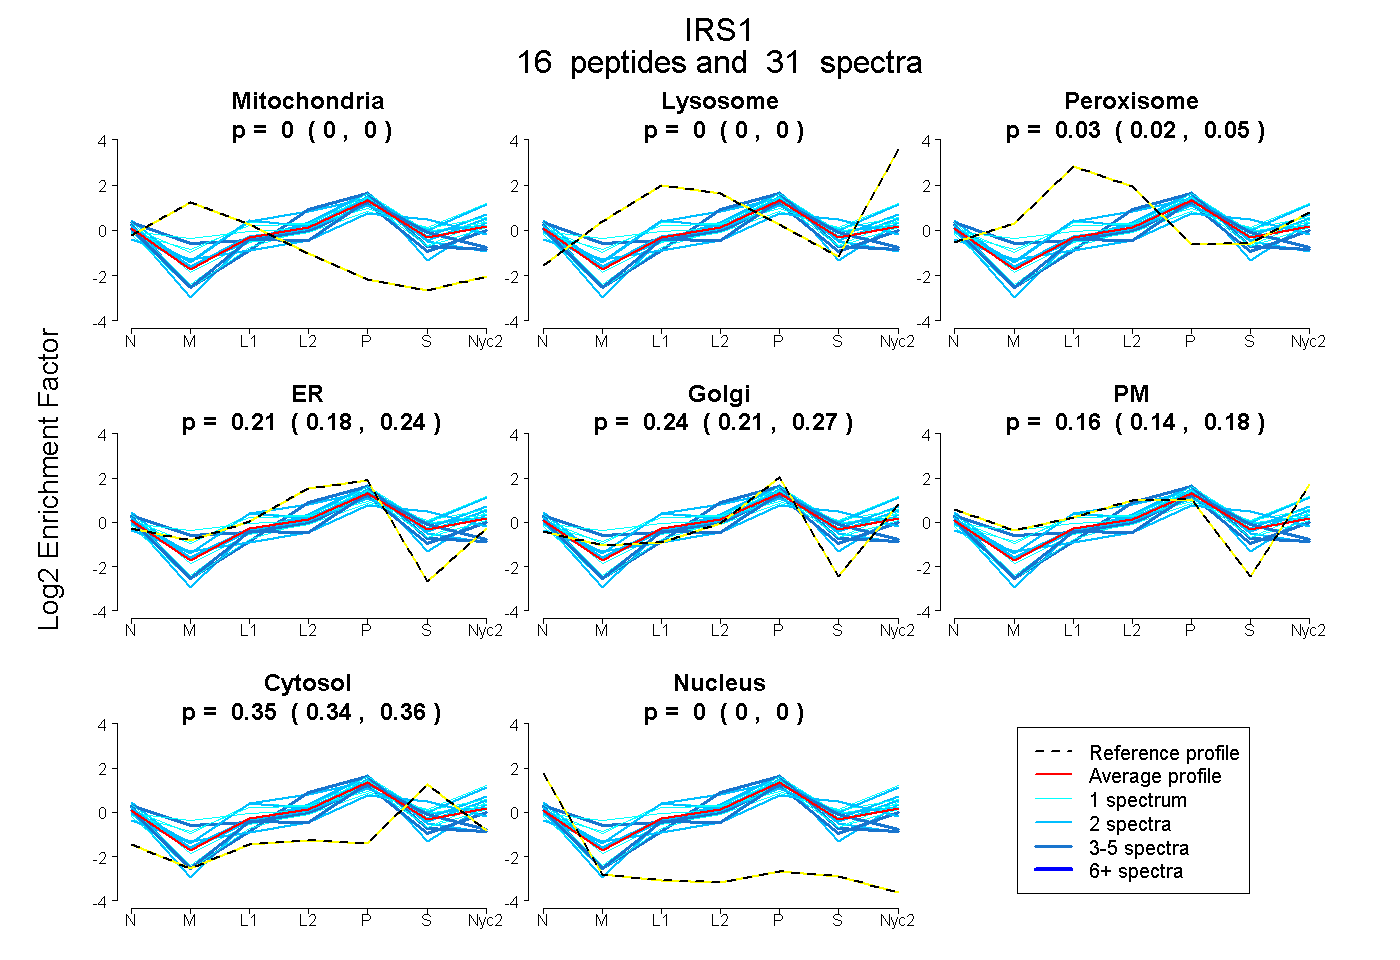
0.000 | 0.000
0.000 | 0.000
0.017 | 0.048
0.182 | 0.241
0.209 | 0.272
0.137 | 0.182
0.337 | 0.357
0.000 | 0.000
2peptides
spectra
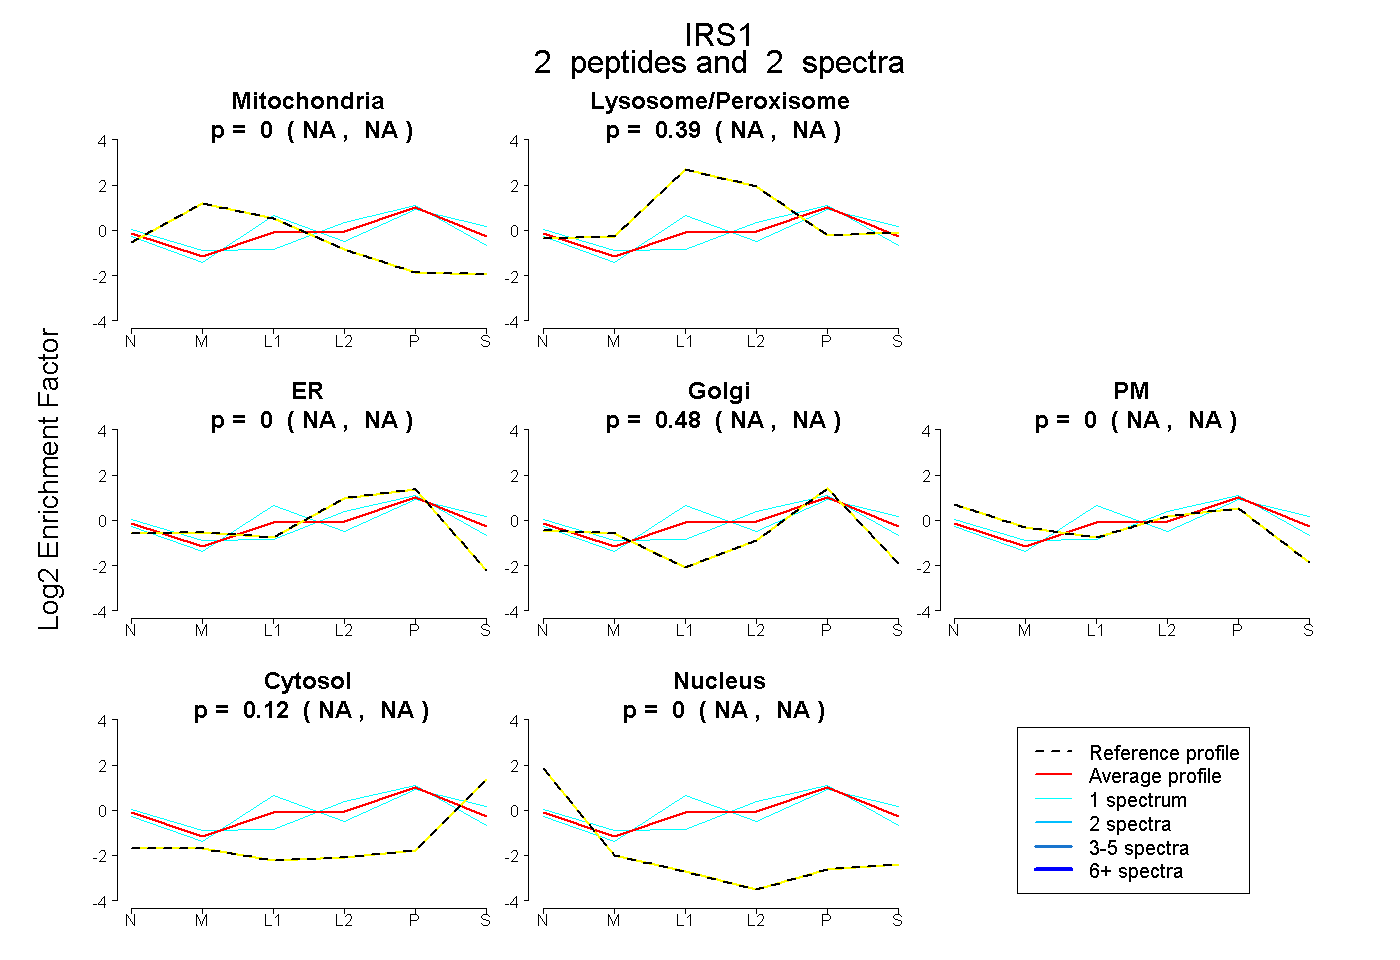
NA | NA
NA | NA
NA | NA
NA | NA
NA | NA
NA | NA
NA | NA
6peptides
spectra
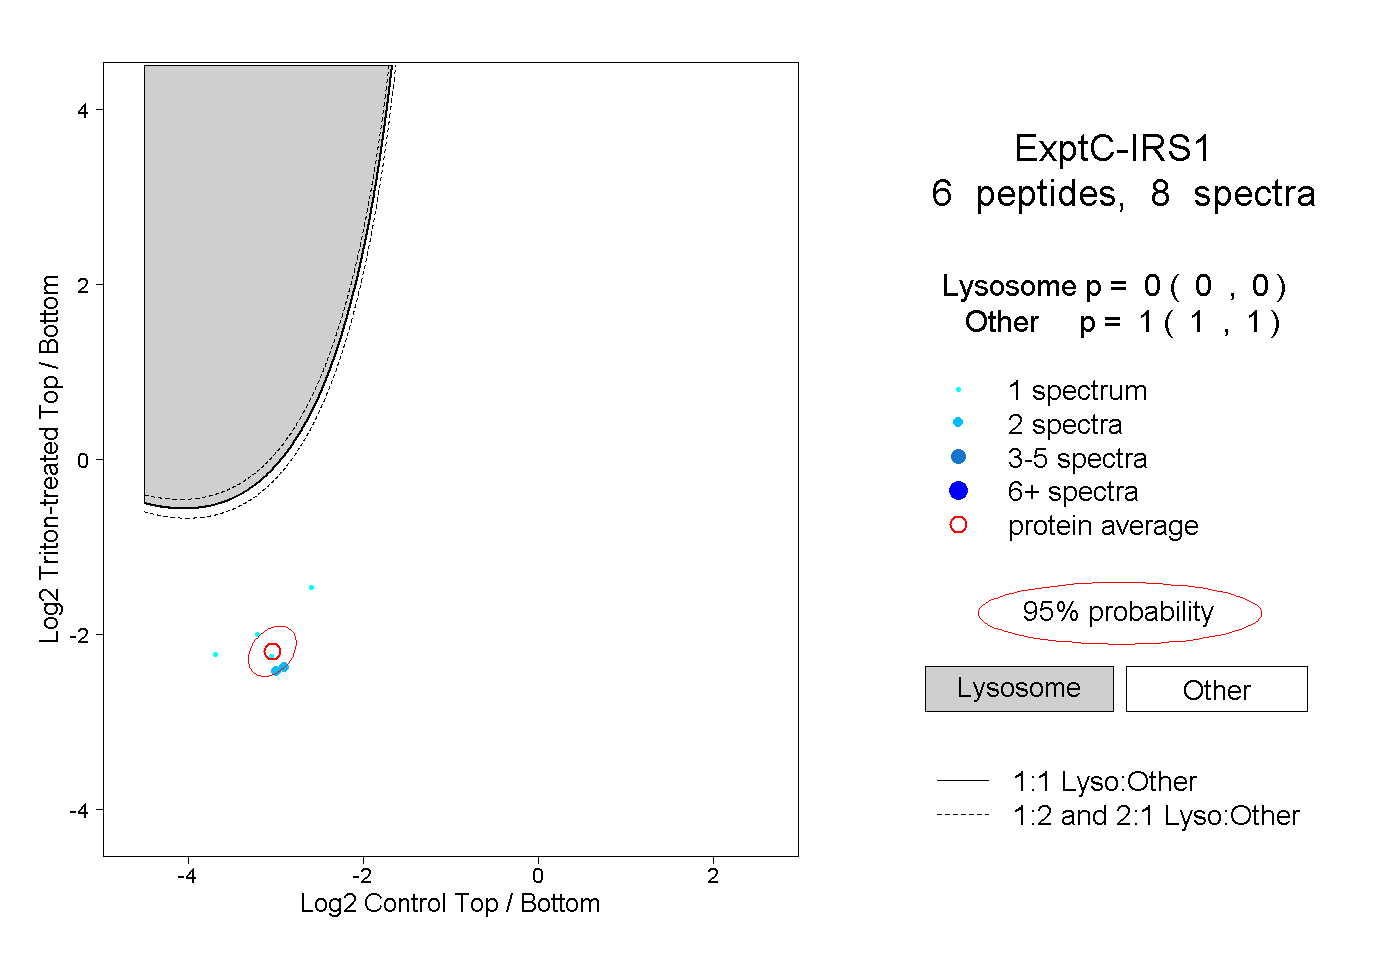
0.000 | 0.000
1.000 | 1.000
1peptide
spectra
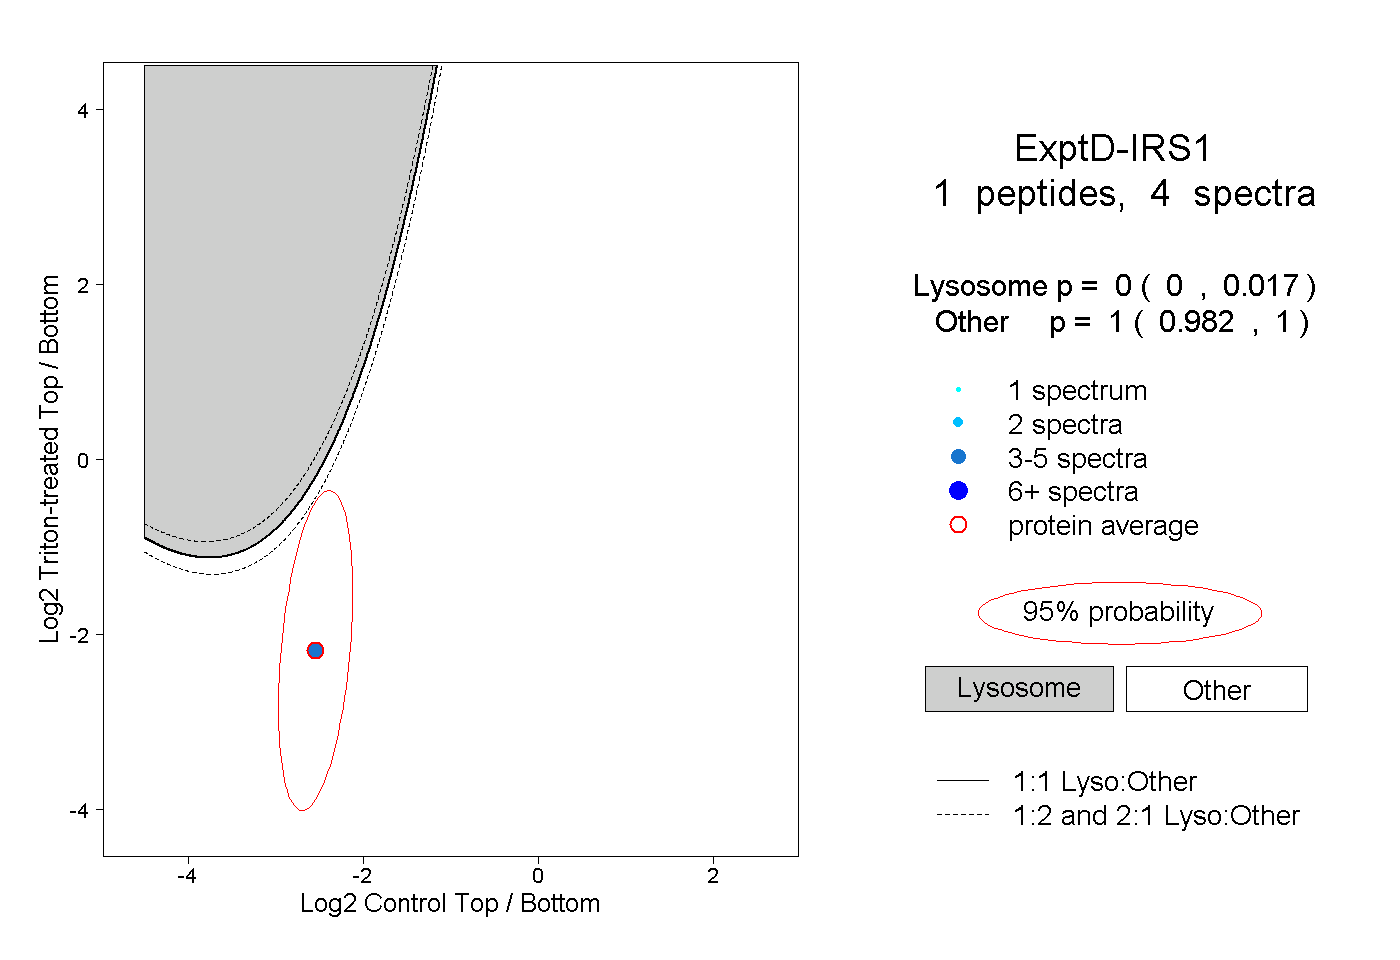
0.000 | 0.017
0.982 | 1.000