 16
16peptides
spectra
0.000 | 0.000
0.000 | 0.000
0.017 | 0.048
0.182 | 0.241
0.209 | 0.272
0.137 | 0.182
0.337 | 0.357
0.000 | 0.000
| Plot | Mito | Lyso | Perox | ER | Golgi | PM | Cytosol | Nucleus | |||||
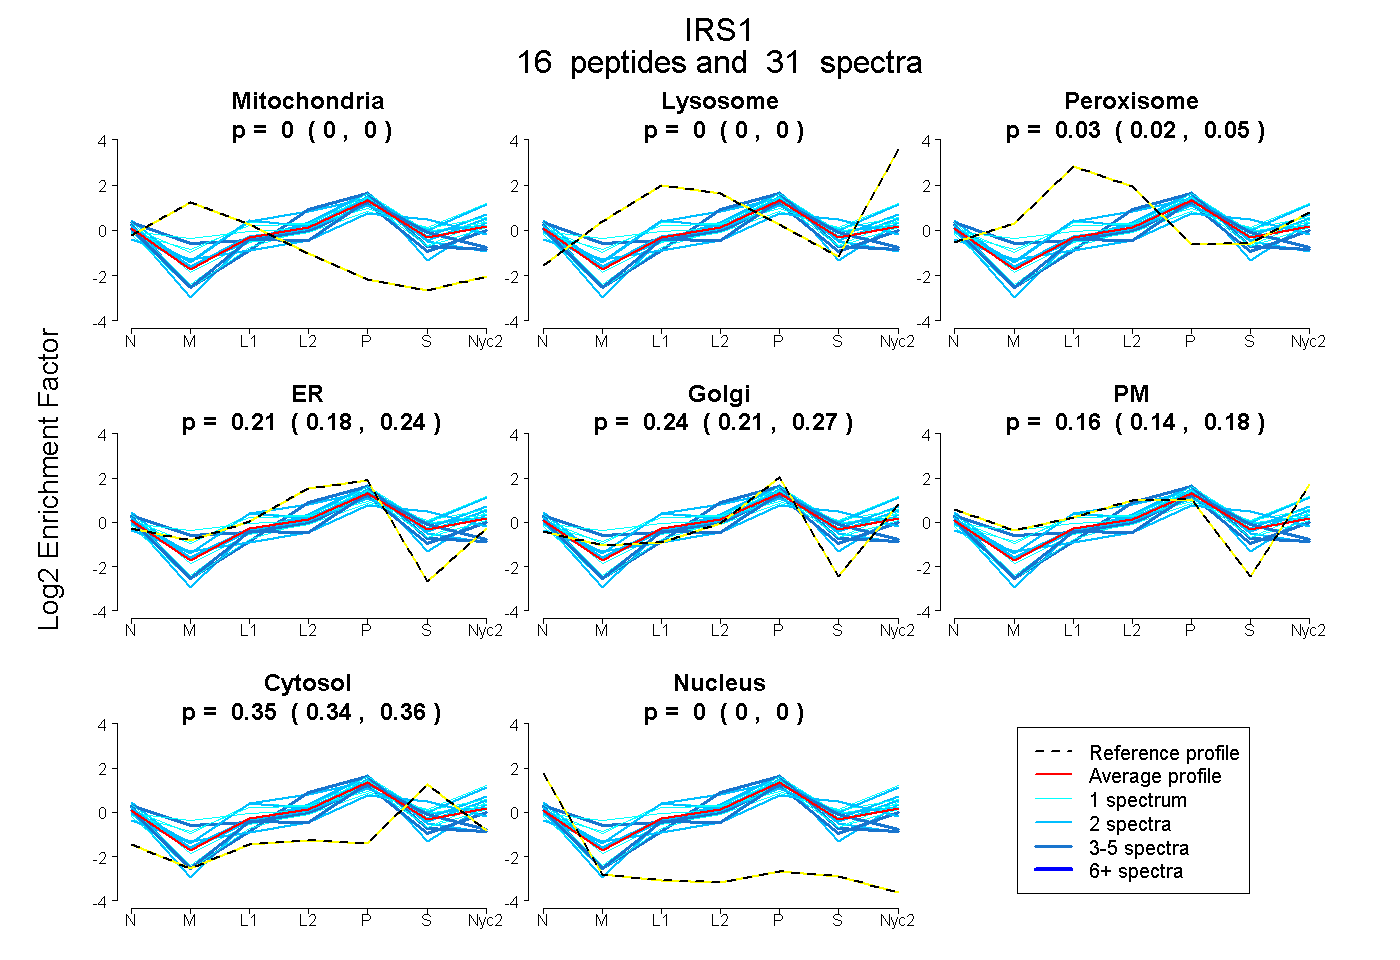
| Expt A |
16 peptides |
31 spectra |
|
0.000 0.000 | 0.000 |
0.000 0.000 | 0.000 |
0.034 0.017 | 0.048 |
0.214 0.182 | 0.241 |
0.243 0.209 | 0.272 |
0.162 0.137 | 0.182 |
0.348 0.337 | 0.357 |
0.000 0.000 | 0.000 |
| 2 spectra, AASEAGGPAR | 0.000 | 0.000 | 0.000 | 0.222 | 0.378 | 0.208 | 0.187 | 0.007 | ||
| 3 spectra, HLVALYTR | 0.000 | 0.000 | 0.000 | 0.647 | 0.000 | 0.000 | 0.332 | 0.021 | ||
| 2 spectra, ATWQESGGVELGR | 0.000 | 0.000 | 0.000 | 0.185 | 0.345 | 0.044 | 0.426 | 0.000 | ||
| 5 spectra, VGPAPPGAASICRPTR | 0.000 | 0.000 | 0.000 | 0.323 | 0.188 | 0.000 | 0.478 | 0.012 | ||
| 2 spectra, LSSSSGR | 0.000 | 0.000 | 0.274 | 0.000 | 0.490 | 0.029 | 0.207 | 0.000 | ||
| 2 spectra, HHLNNPPPSQVGLTR | 0.000 | 0.000 | 0.203 | 0.223 | 0.180 | 0.180 | 0.214 | 0.000 | ||
| 1 spectrum, SVPNSR | 0.000 | 0.000 | 0.000 | 0.000 | 0.045 | 0.526 | 0.429 | 0.000 | ||
| 1 spectrum, SVSAPQQIINPIR | 0.000 | 0.004 | 0.306 | 0.000 | 0.356 | 0.062 | 0.273 | 0.000 | ||
| 2 spectra, SVNPSR | 0.000 | 0.071 | 0.000 | 0.000 | 0.138 | 0.427 | 0.365 | 0.000 | ||
| 2 spectra, AMSDEFRPR | 0.000 | 0.000 | 0.000 | 0.636 | 0.000 | 0.000 | 0.364 | 0.000 | ||
| 1 spectrum, SIPMPSSR | 0.000 | 0.000 | 0.000 | 0.053 | 0.470 | 0.091 | 0.387 | 0.000 | ||
| 1 spectrum, LHPPLNHSR | 0.021 | 0.000 | 0.246 | 0.036 | 0.530 | 0.000 | 0.167 | 0.000 | ||
| 2 spectra, TISFVK | 0.000 | 0.000 | 0.091 | 0.017 | 0.385 | 0.000 | 0.507 | 0.000 | ||
| 1 spectrum, HTQRPGEPEEGAR | 0.000 | 0.000 | 0.000 | 0.119 | 0.488 | 0.000 | 0.394 | 0.000 | ||
| 1 spectrum, LCLTSK | 0.000 | 0.000 | 0.281 | 0.030 | 0.523 | 0.025 | 0.142 | 0.000 | ||
| 3 spectra, LEYYENEK | 0.038 | 0.000 | 0.056 | 0.121 | 0.343 | 0.212 | 0.211 | 0.019 |
| Plot | Mito | Lyso or Perox | ER | Golgi | PM | Cytosol | Nucleus | ||||||
| Expt B |
2 peptides |
2 spectra |
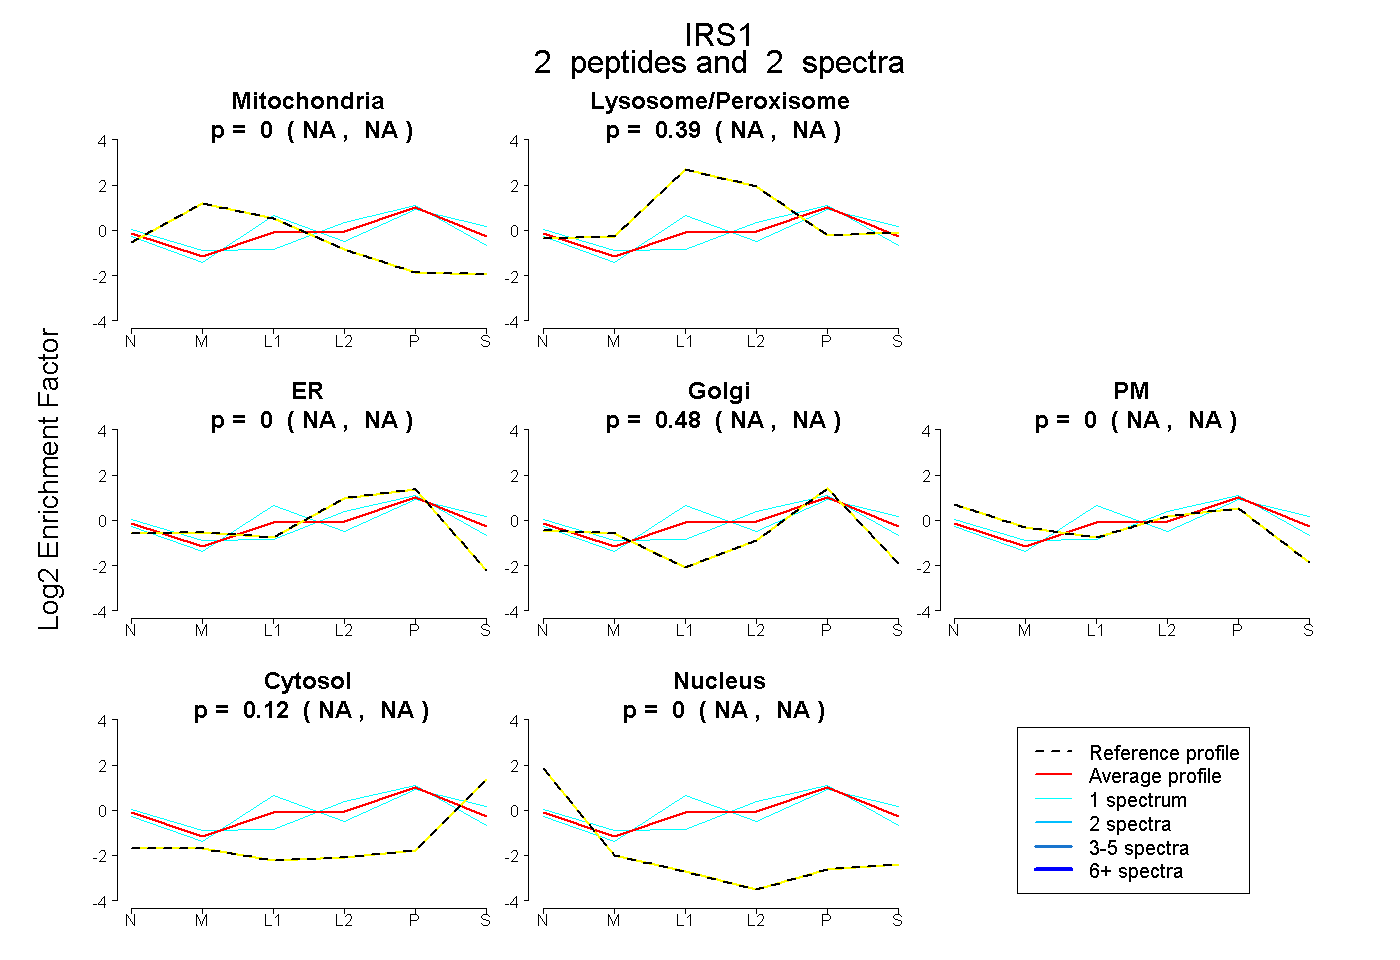 |
0.000 NA | NA |
0.394 NA | NA |
0.000 NA | NA |
0.484 NA | NA |
0.000 NA | NA |
0.122 NA | NA |
0.000 NA | NA |
|||
| Plot | Lyso | Other | |||||||||||
| Expt C |
6 peptides |
8 spectra |
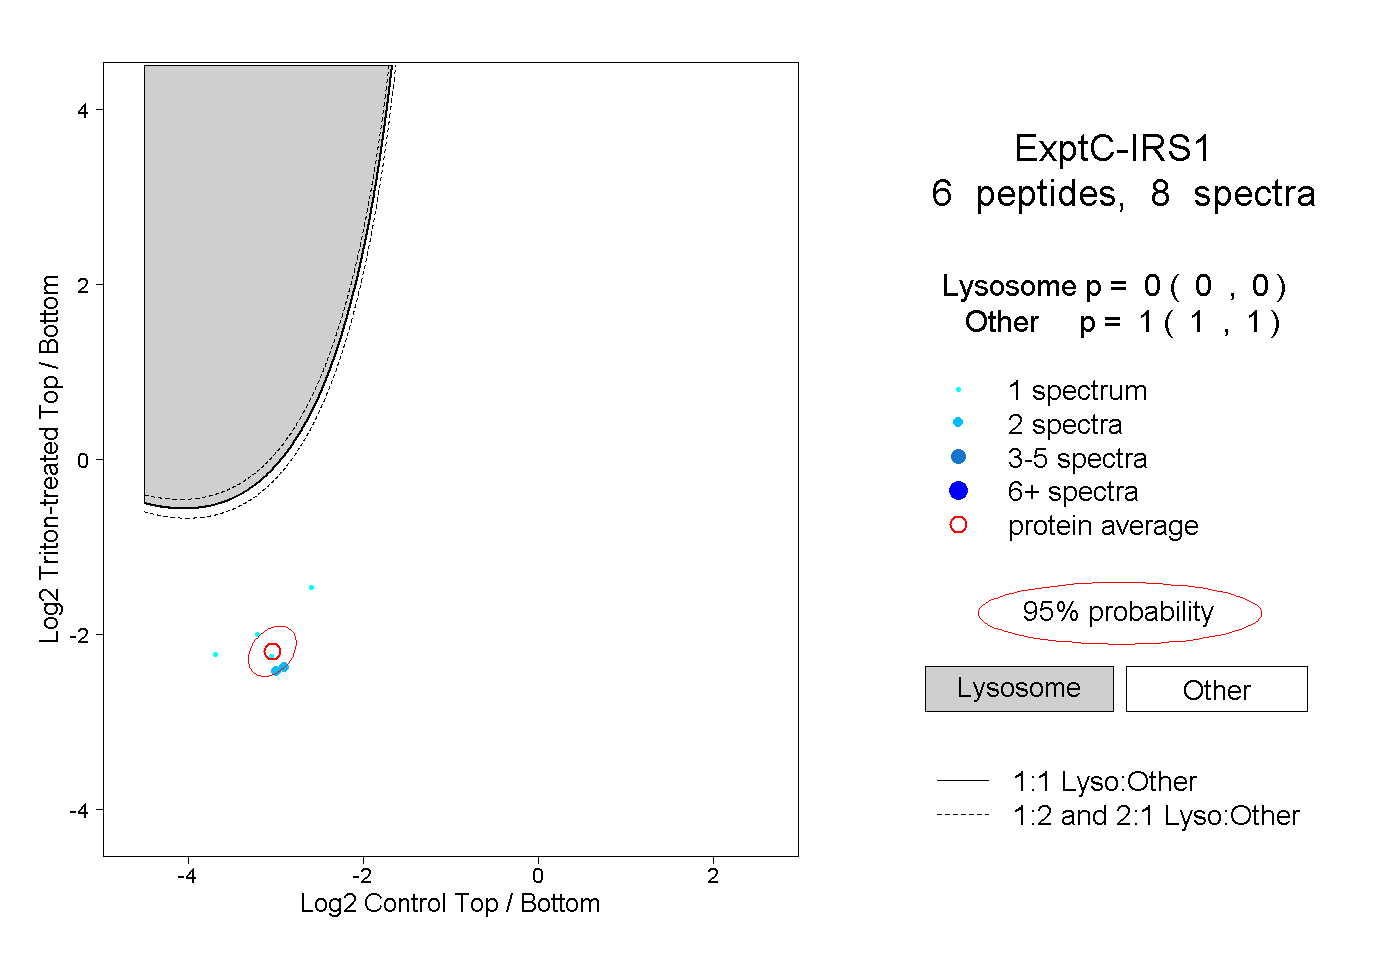 |
0.000 0.000 | 0.000 |
1.000 1.000 | 1.000 |
||||||||
| Plot | Lyso | Other | |||||||||||
| Expt D |
1 peptide |
4 spectra |
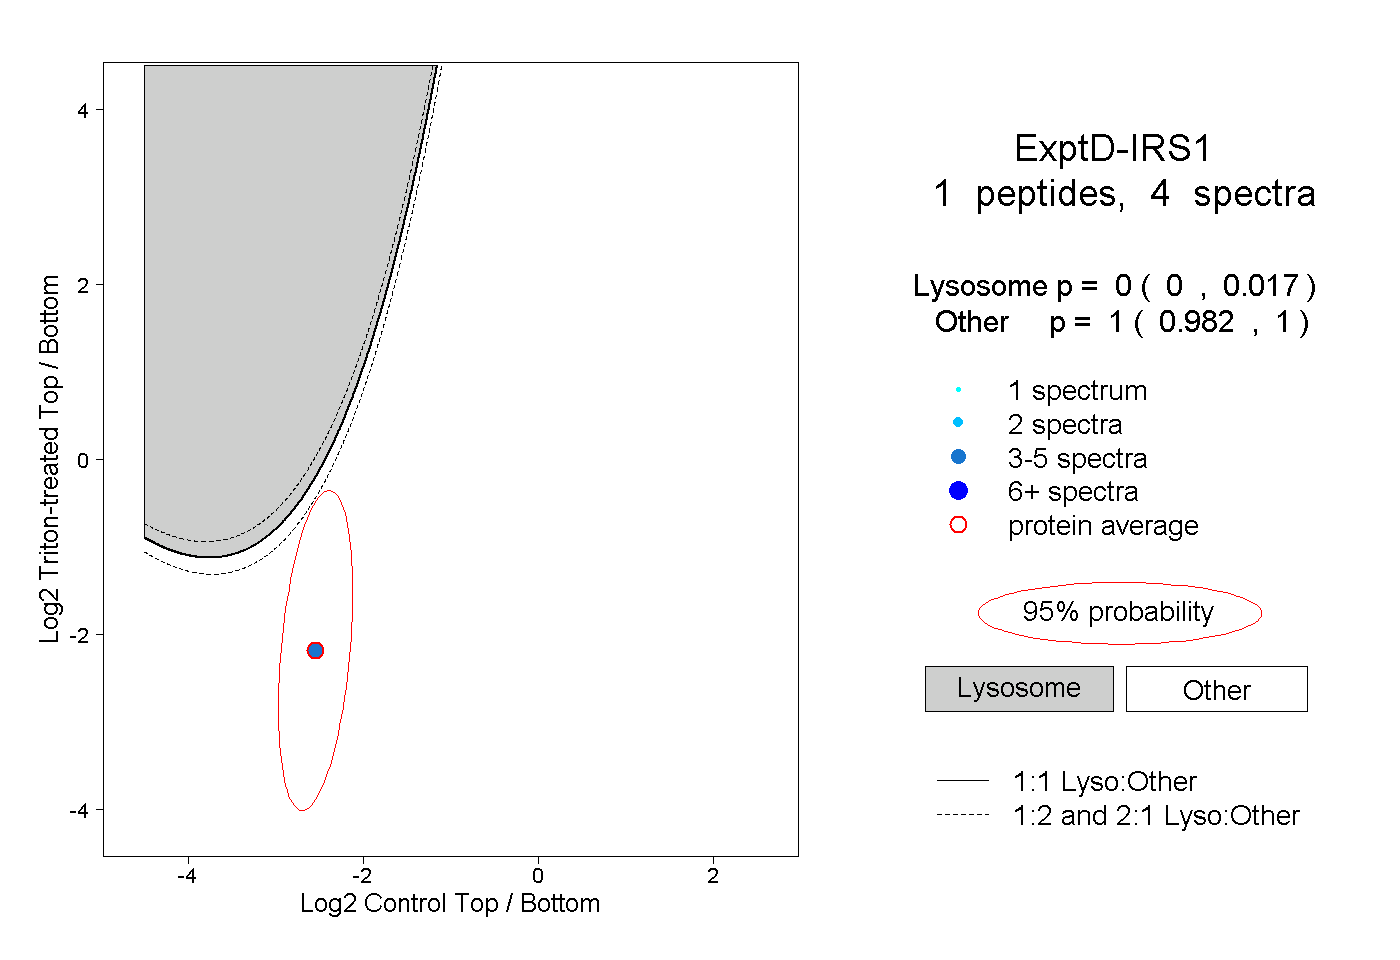 |
0.000 0.000 | 0.017 |
1.000 0.982 | 1.000 |