 20
20peptides
spectra
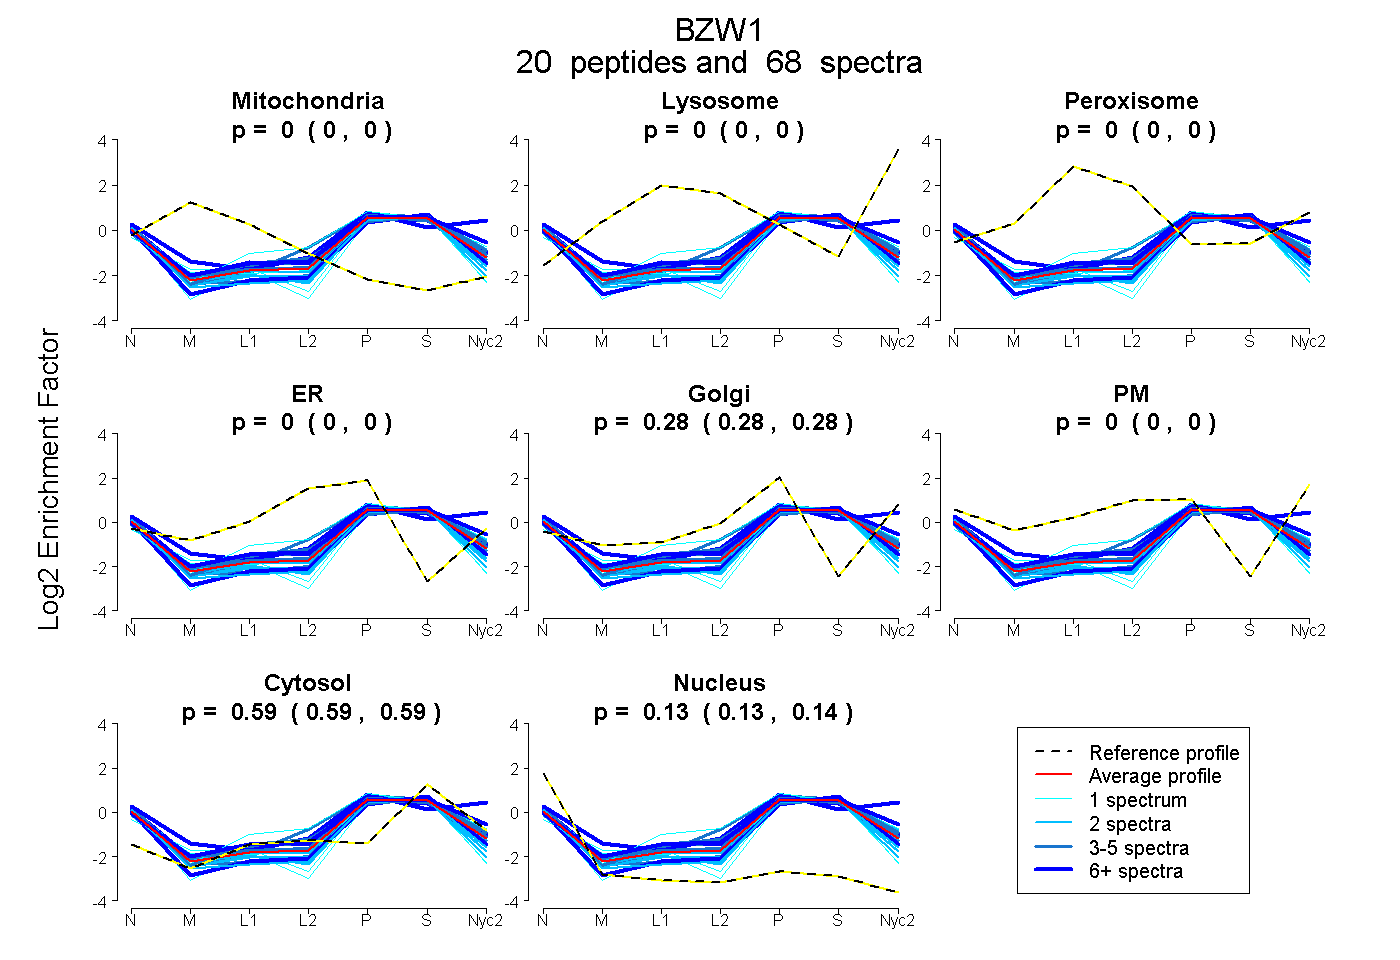
0.000 | 0.000
0.000 | 0.000
0.000 | 0.000
0.000 | 0.000
0.276 | 0.281
0.000 | 0.000
0.587 | 0.590
0.129 | 0.135
11peptides
spectra
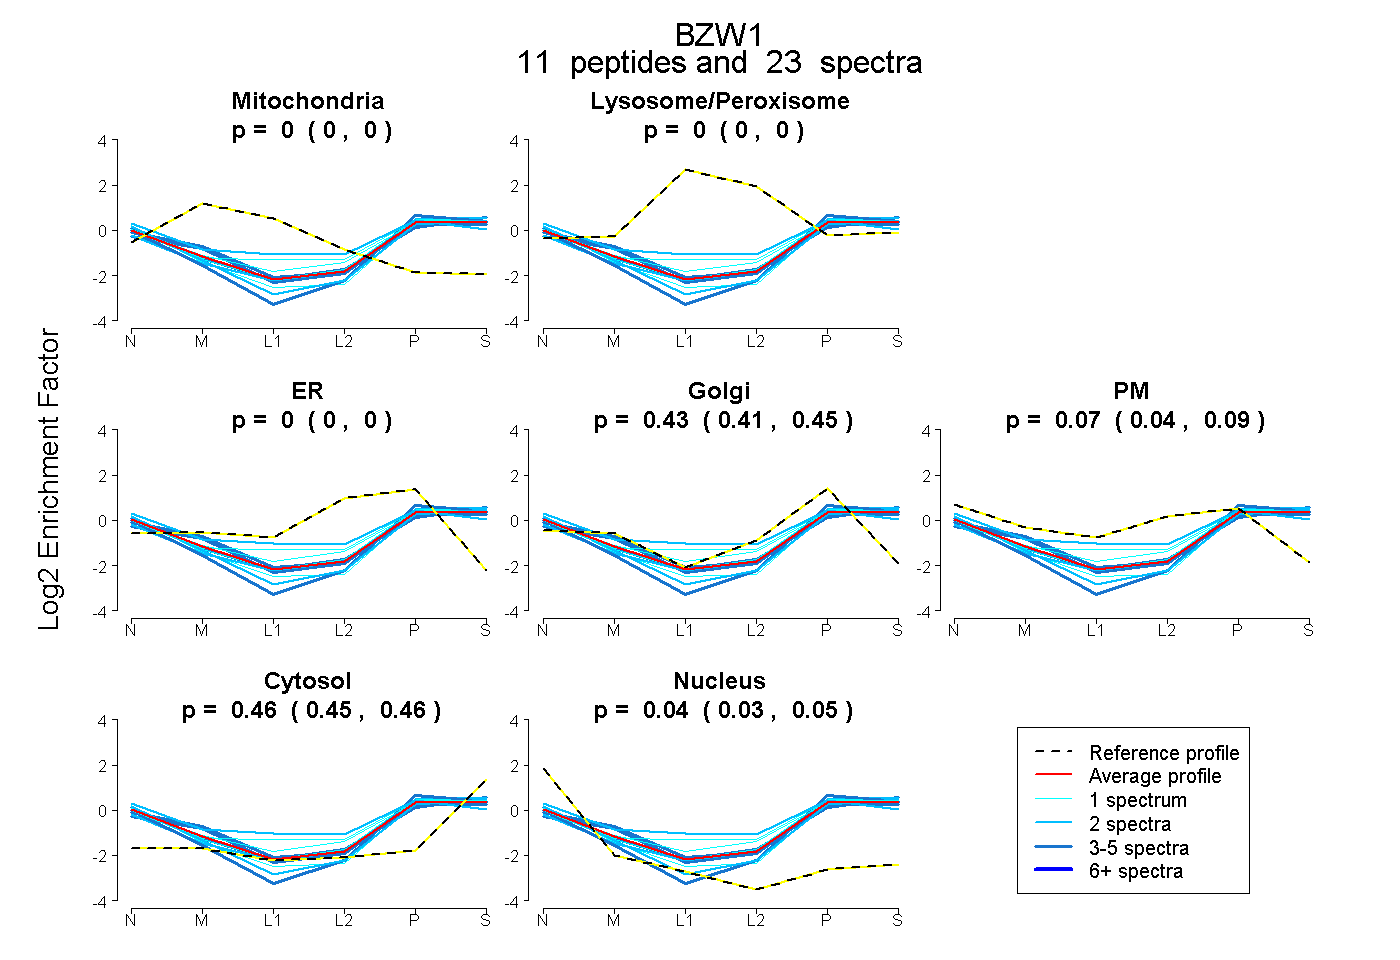
0.000 | 0.000
0.000 | 0.000
0.000 | 0.000
0.411 | 0.454
0.040 | 0.089
0.452 | 0.462
0.035 | 0.049
11peptides
spectra
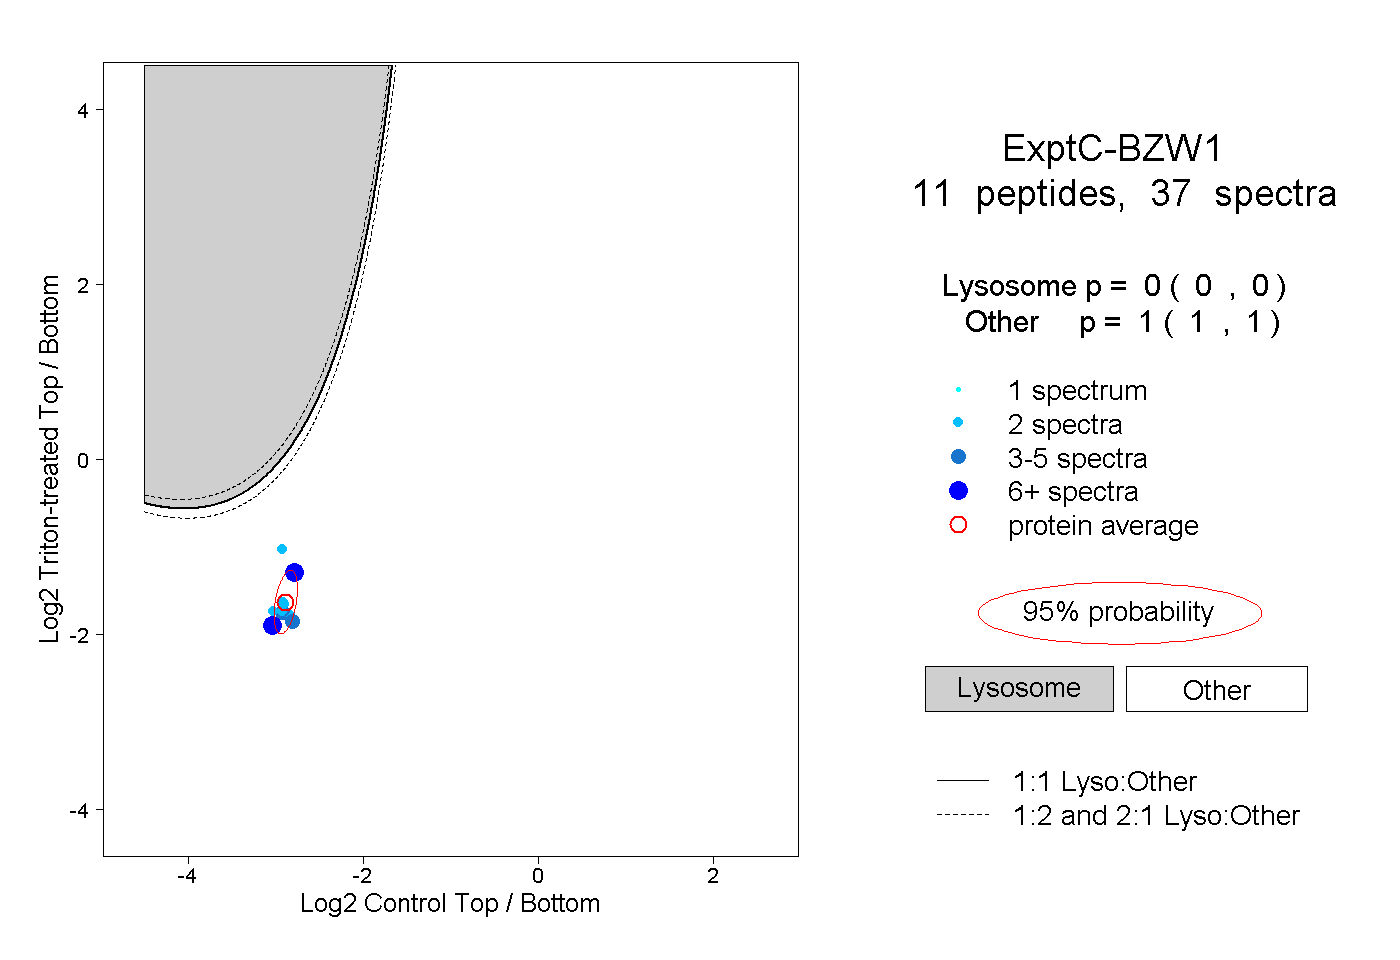
0.000 | 0.000
1.000 | 1.000
3peptides
spectra
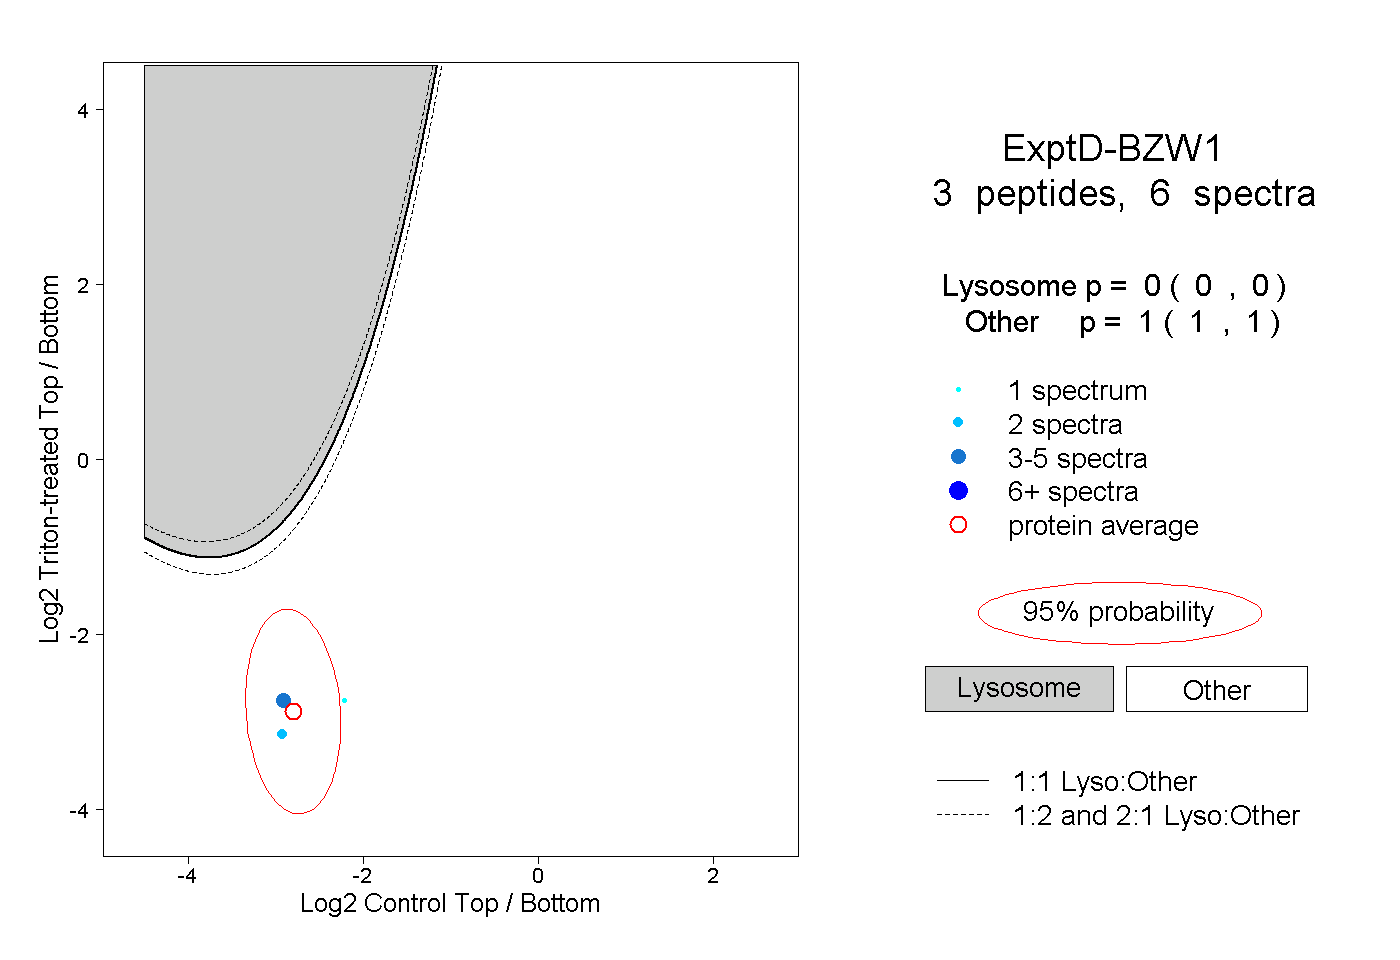
0.000 | 0.000
1.000 | 1.000