 18
18peptides
spectra
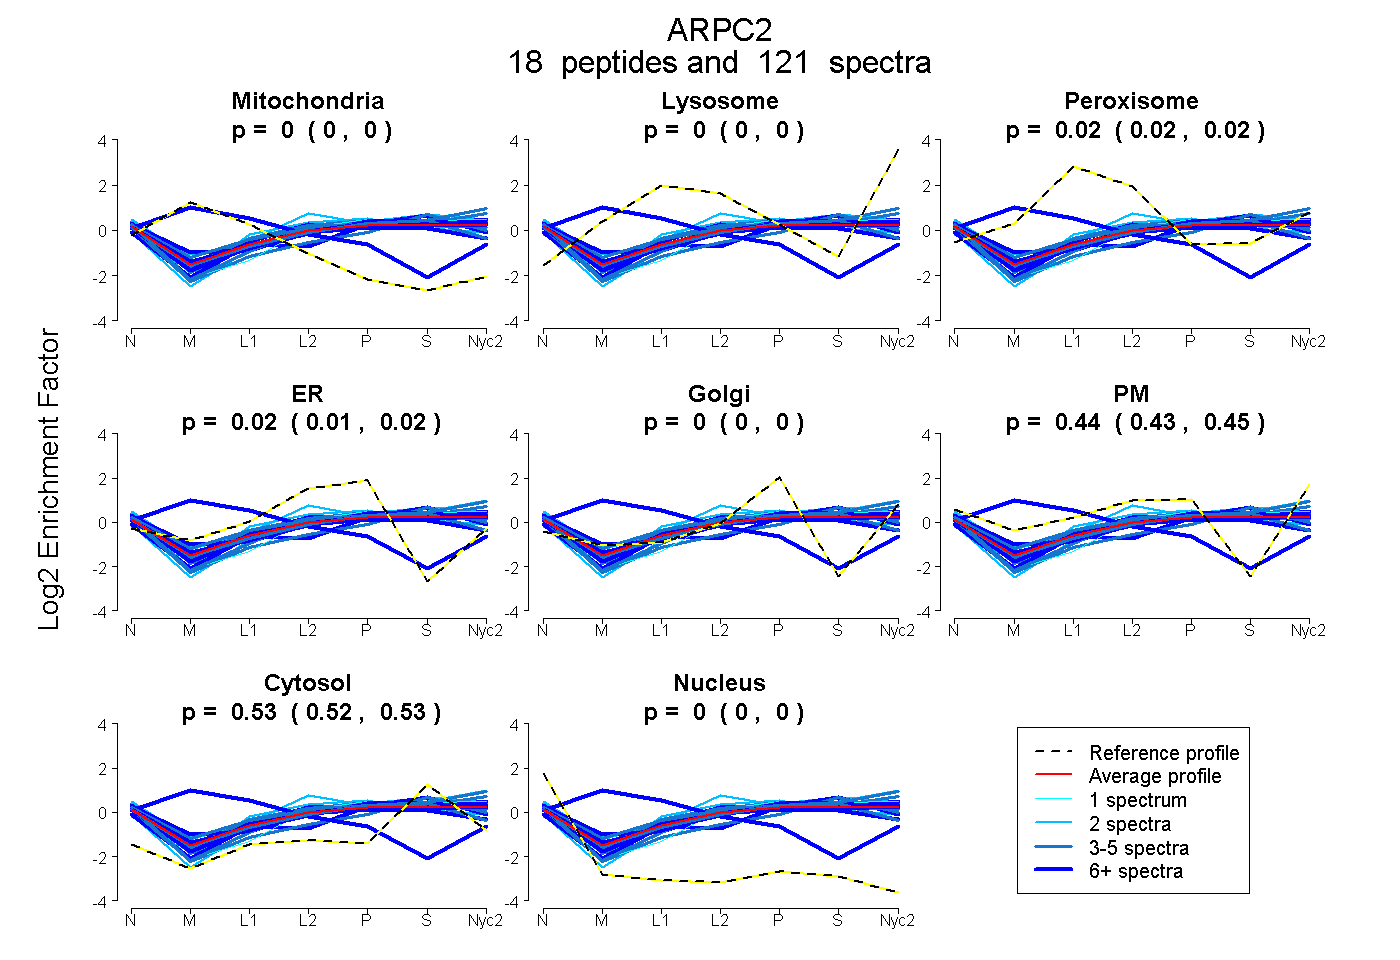
0.000 | 0.000
0.000 | 0.000
0.016 | 0.024
0.008 | 0.021
0.000 | 0.000
0.432 | 0.446
0.522 | 0.528
0.000 | 0.000
10peptides
spectra
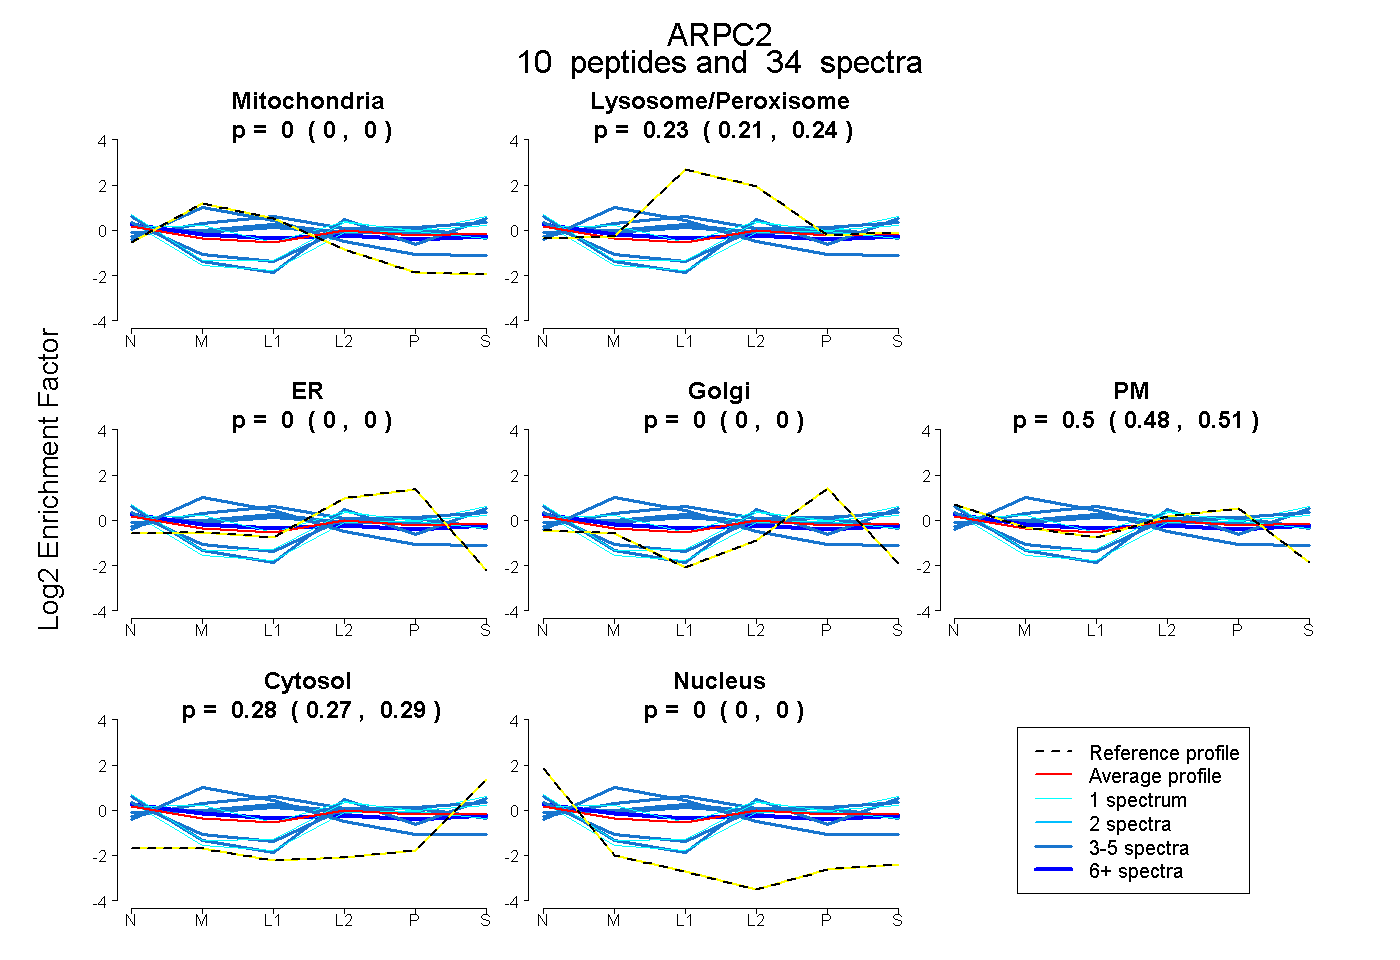
0.000 | 0.000
0.206 | 0.240
0.000 | 0.000
0.000 | 0.000
0.480 | 0.513
0.268 | 0.286
0.000 | 0.000
19peptides
spectra
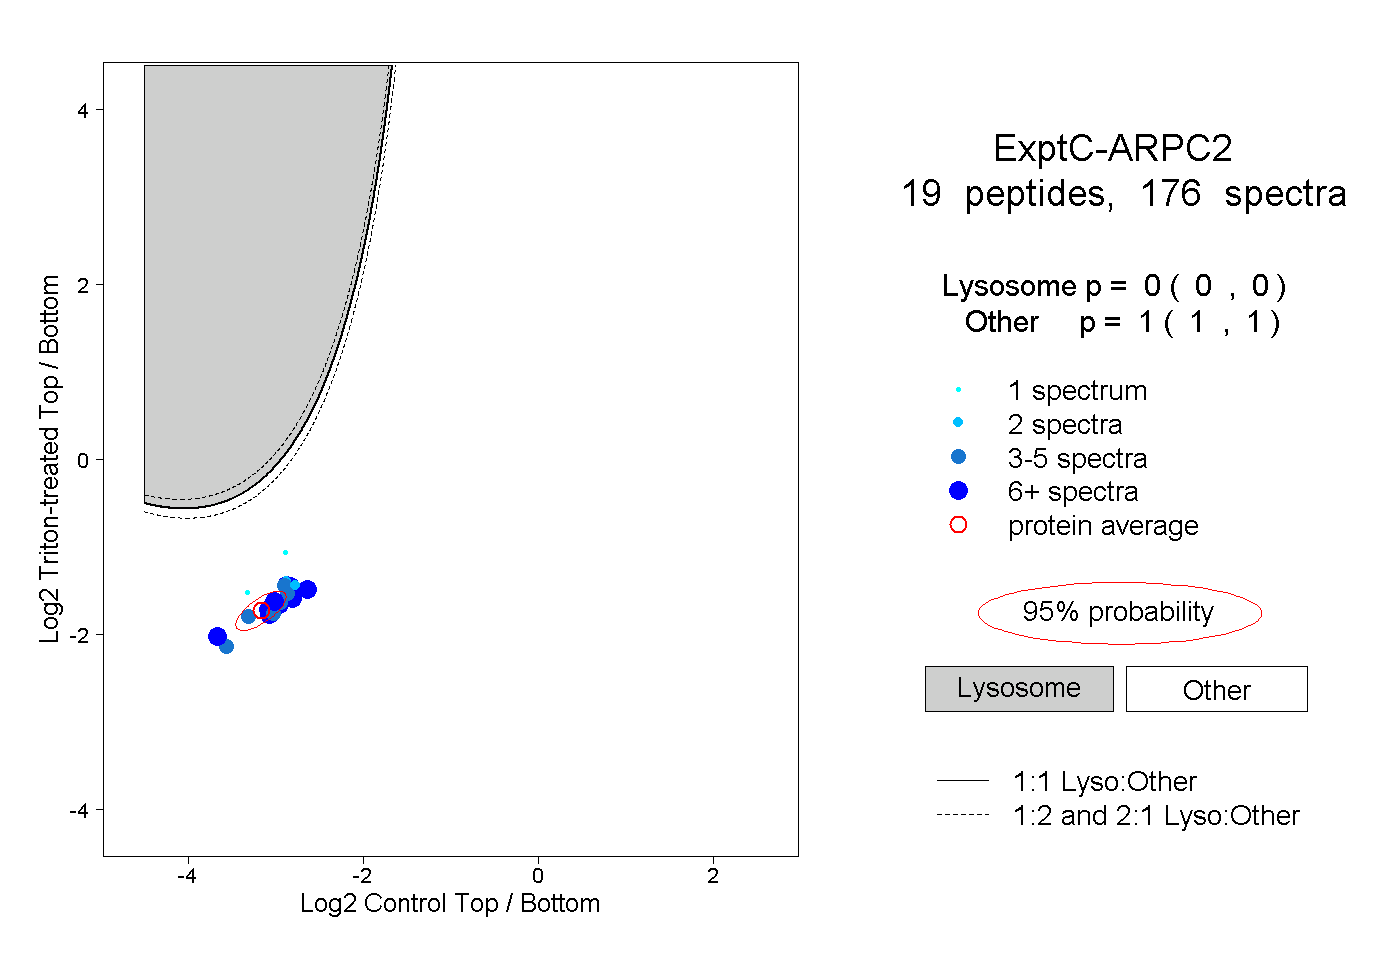
0.000 | 0.000
1.000 | 1.000
5peptides
spectra
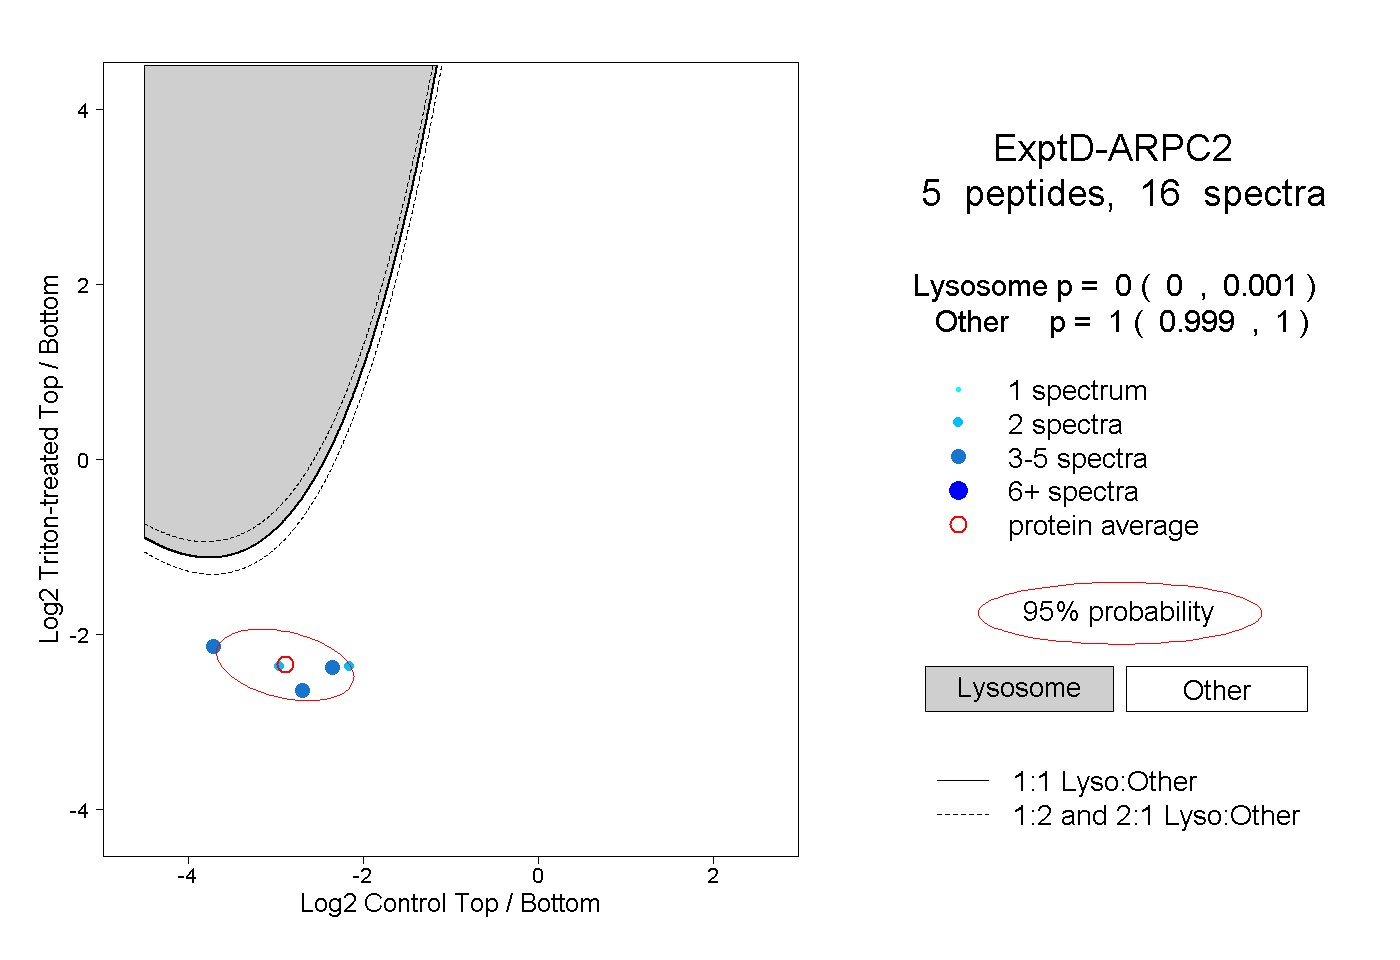
0.000 | 0.001
0.999 | 1.000