ARPC2
[ENSRNOP00000019265]
Main page
| | | Plot |
Mito |
Lyso |
|
Perox |
ER |
Golgi |
PM |
Cytosol |
Nucleus |
|
| Expt A |
 18
18
peptides |
121
spectra |
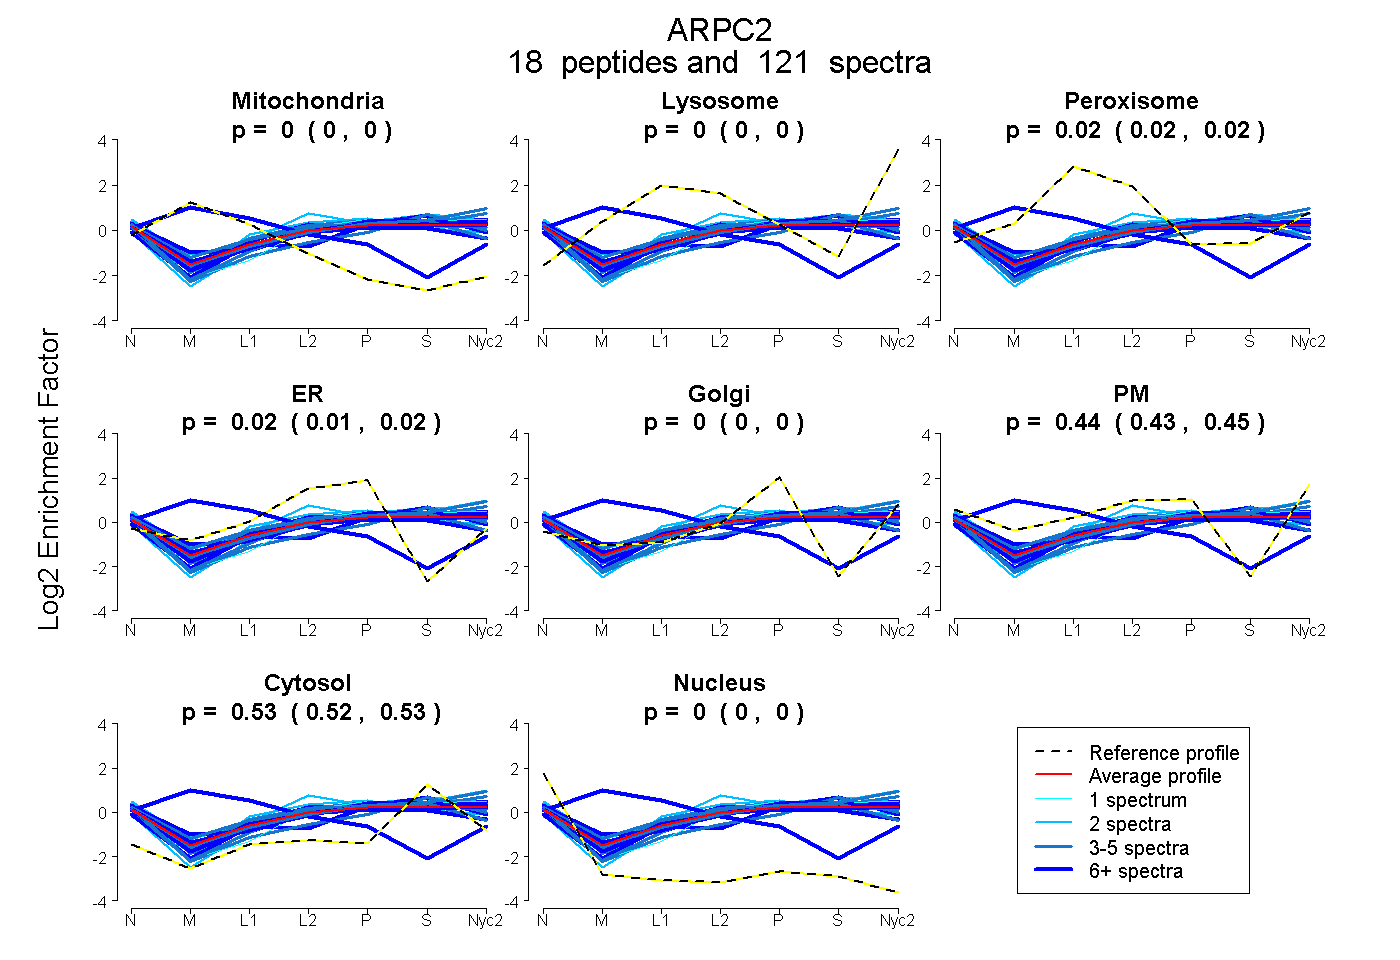 |
0.000
0.000 | 0.000 |
0.000
0.000 | 0.000 |
|
0.020
0.016 | 0.024 |
0.015
0.008 | 0.021 |
0.000
0.000 | 0.000 |
0.439
0.432 | 0.446 |
0.525
0.522 | 0.528 |
0.000
0.000 | 0.000 |
|
| | | Plot |
Mito |
|
Lyso or Perox |
|
ER |
Golgi |
PM |
Cytosol |
Nucleus |
|
| Expt B |
10
peptides |
34
spectra |
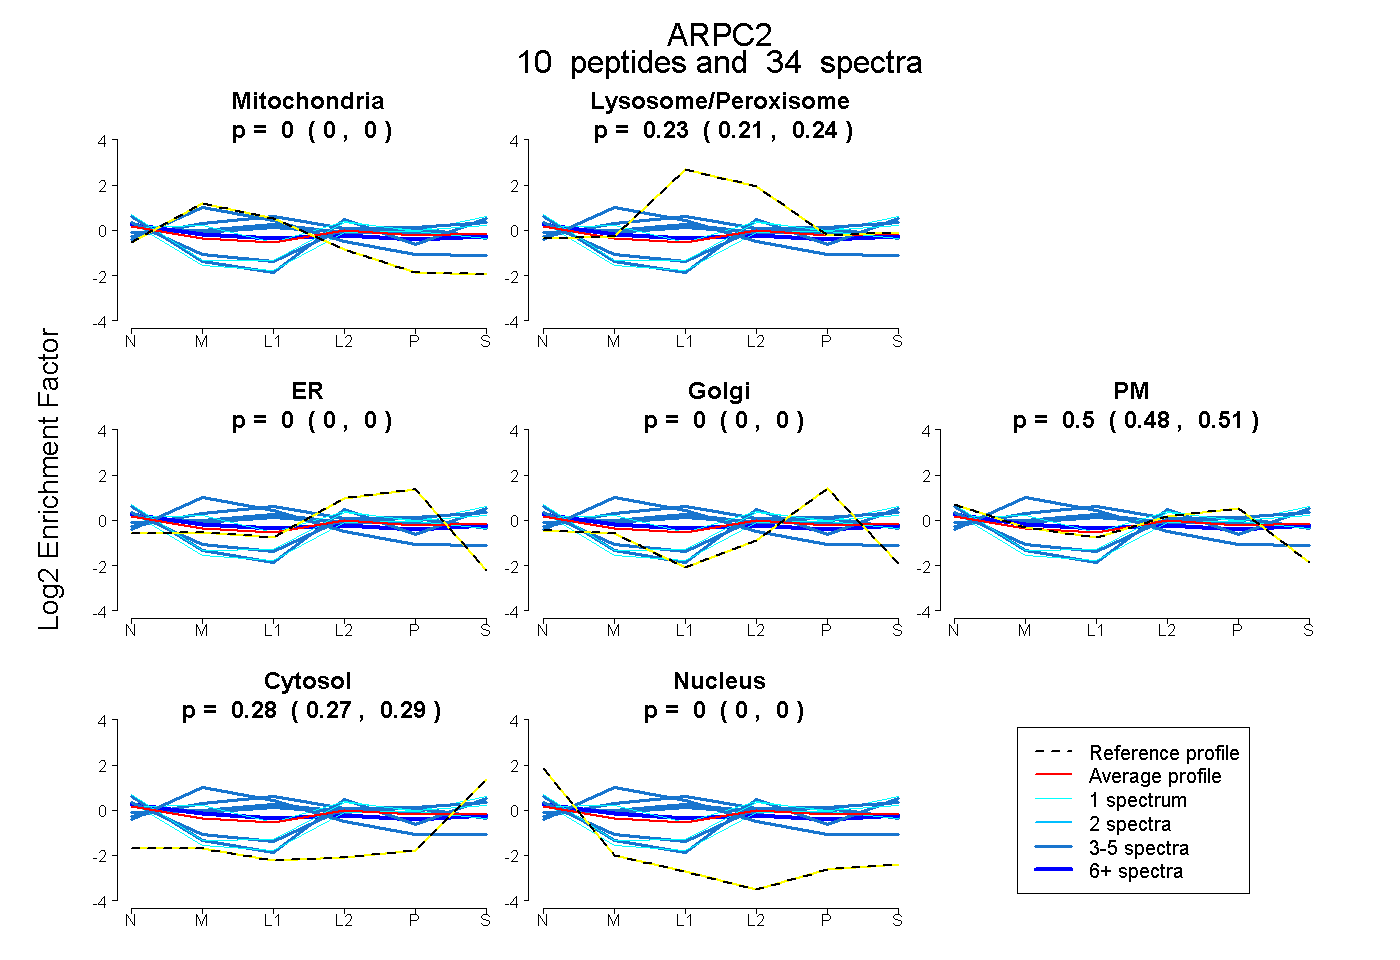 |
0.000
0.000 | 0.000 |
|
0.225
0.206 | 0.240 |
|
0.000
0.000 | 0.000 |
0.000
0.000 | 0.000 |
0.497
0.480 | 0.513 |
0.277
0.268 | 0.286 |
0.000
0.000 | 0.000 |
|
| 1 spectrum, NCFASVFEK |
0.000 |
|
0.114 |
|
0.000 |
0.000 |
0.571 |
0.314 |
0.000 |
|
| 3 spectra, LLEVDNR |
0.664 |
|
0.175 |
|
0.000 |
0.104 |
0.000 |
0.058 |
0.000 |
|
| 1 spectrum, ELQAHGADELLK |
0.000 |
|
0.044 |
|
0.000 |
0.000 |
0.501 |
0.455 |
0.000 |
|
| 8 spectra, DNTINLIHTFR |
0.069 |
|
0.214 |
|
0.000 |
0.000 |
0.453 |
0.251 |
0.012 |
|
| 3 spectra, AYIHTR |
0.032 |
|
0.299 |
|
0.000 |
0.012 |
0.479 |
0.178 |
0.000 |
|
| 1 spectrum, IIEETLALK |
0.021 |
|
0.238 |
|
0.000 |
0.000 |
0.558 |
0.183 |
0.000 |
|
| 4 spectra, AVIHYR |
0.110 |
|
0.349 |
|
0.000 |
0.087 |
0.271 |
0.182 |
0.000 |
|
| 5 spectra, MILLEVNNR |
0.000 |
|
0.101 |
|
0.000 |
0.000 |
0.542 |
0.358 |
0.000 |
|
| 3 spectra, DYLHYHIK |
0.000 |
|
0.079 |
|
0.000 |
0.000 |
0.501 |
0.420 |
0.000 |
|
| 5 spectra, ASHTAPQVLFSHR |
0.176 |
|
0.463 |
|
0.000 |
0.265 |
0.000 |
0.096 |
0.000 |
|
| | | Plot |
|
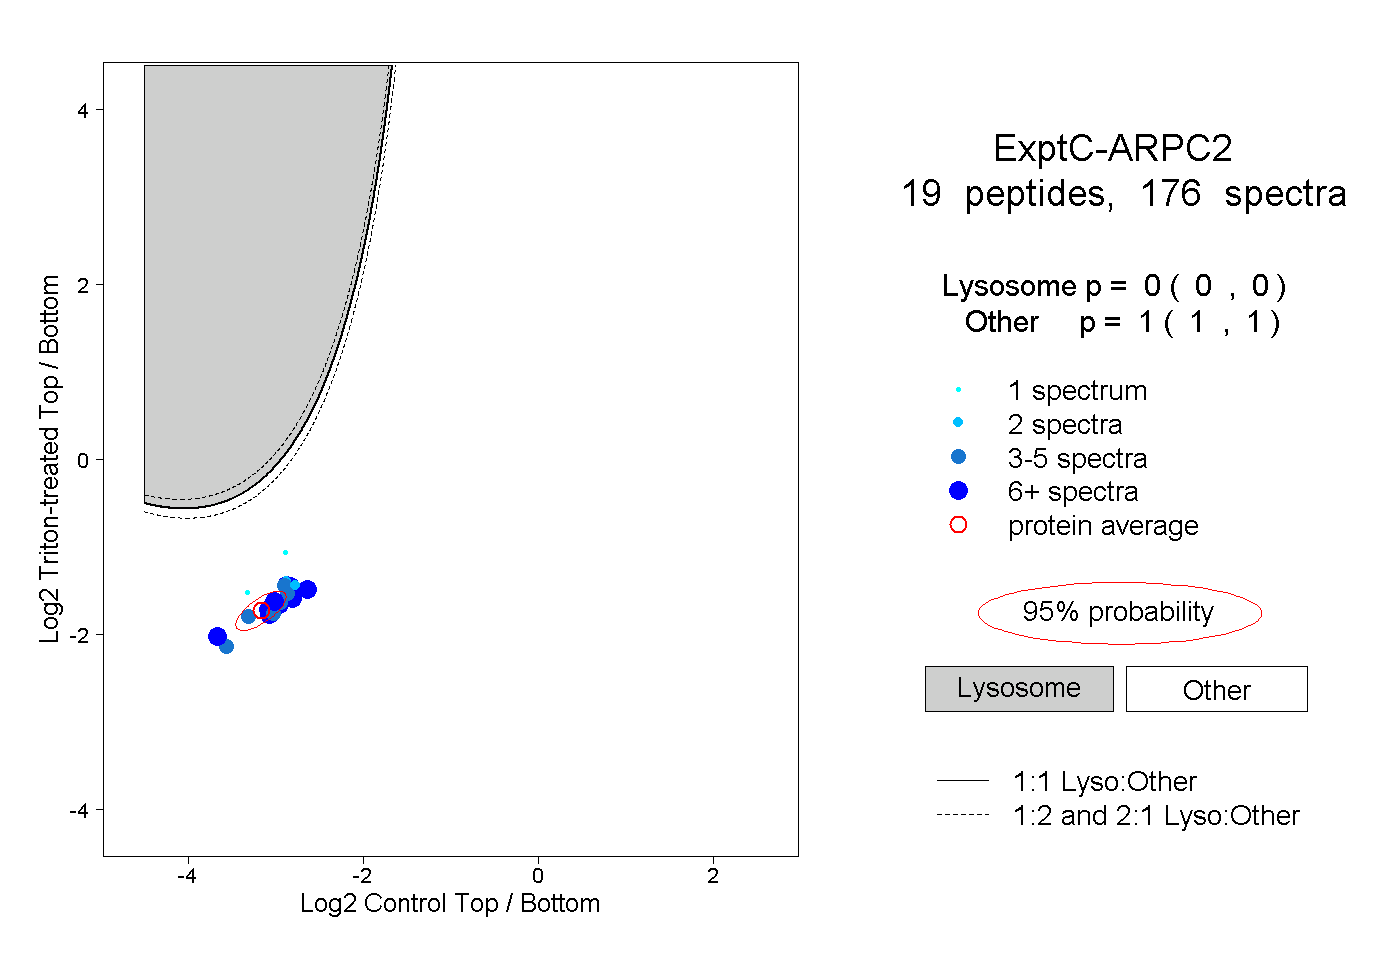
Lyso |
|
|
|
|
|
|
|
Other |
| Expt C |
19
peptides |
176
spectra |
 |
|
0.000
0.000 | 0.000 |
|
|
|
|
|
|
|
1.000
1.000 | 1.000 |
| | | Plot |
|
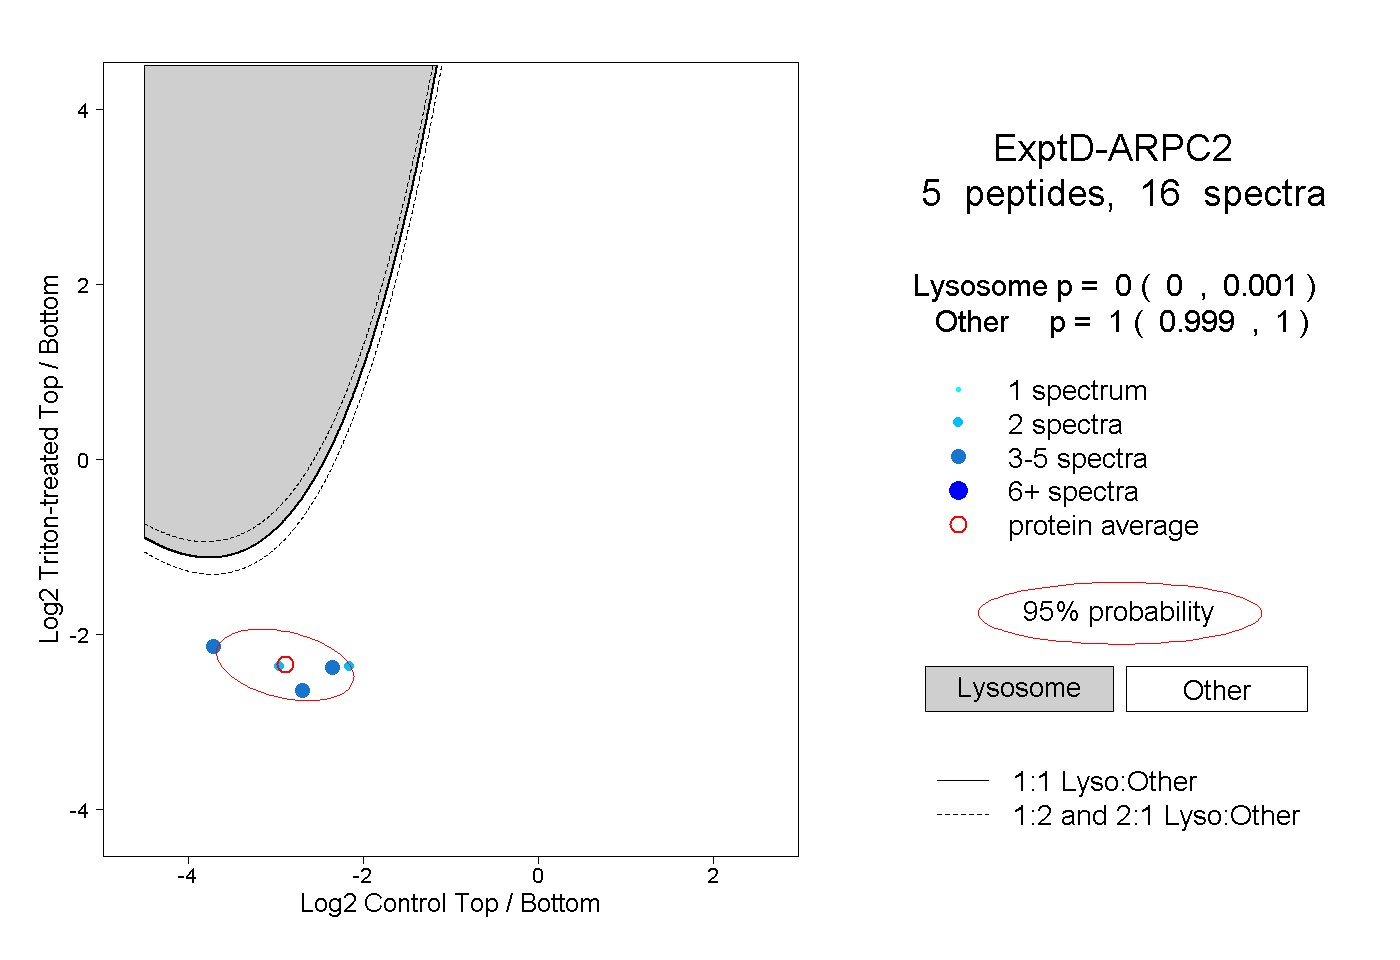
Lyso |
|
|
|
|
|
|
|
Other |
| Expt D |
5
peptides |
16
spectra |
 |
|
0.000
0.000 | 0.001 |
|
|
|
|
|
|
|
1.000
0.999 | 1.000 |