 32
32peptides
spectra
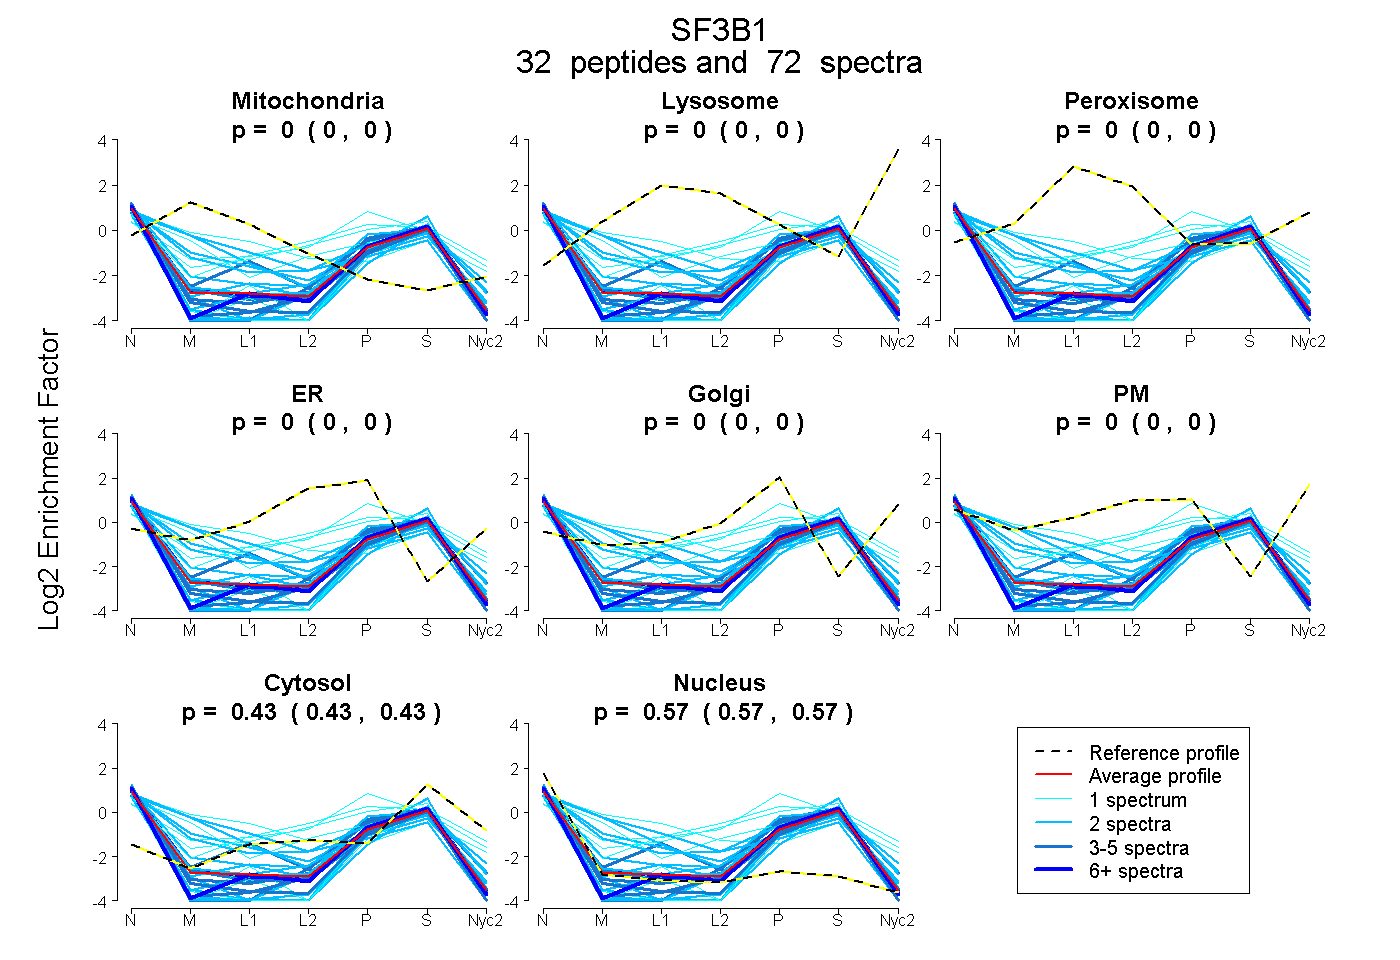
0.000 | 0.000
0.000 | 0.000
0.000 | 0.000
0.000 | 0.000
0.000 | 0.000
0.000 | 0.000
0.427 | 0.432
0.567 | 0.573
5peptides
spectra
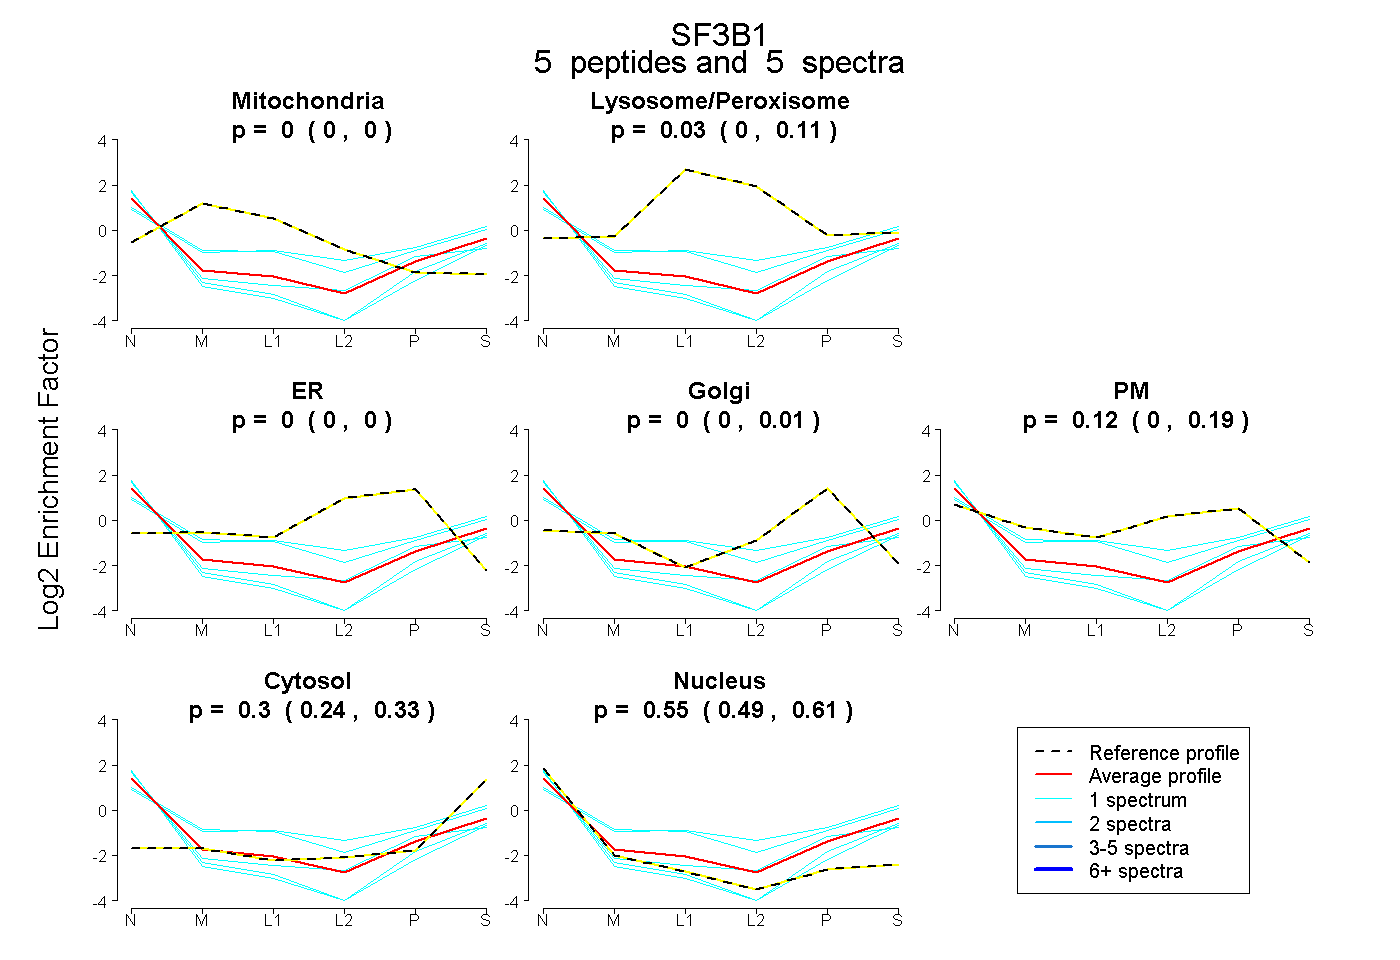
0.000 | 0.000
0.000 | 0.114
0.000 | 0.000
0.000 | 0.015
0.000 | 0.192
0.242 | 0.332
0.491 | 0.613
2peptides
spectra
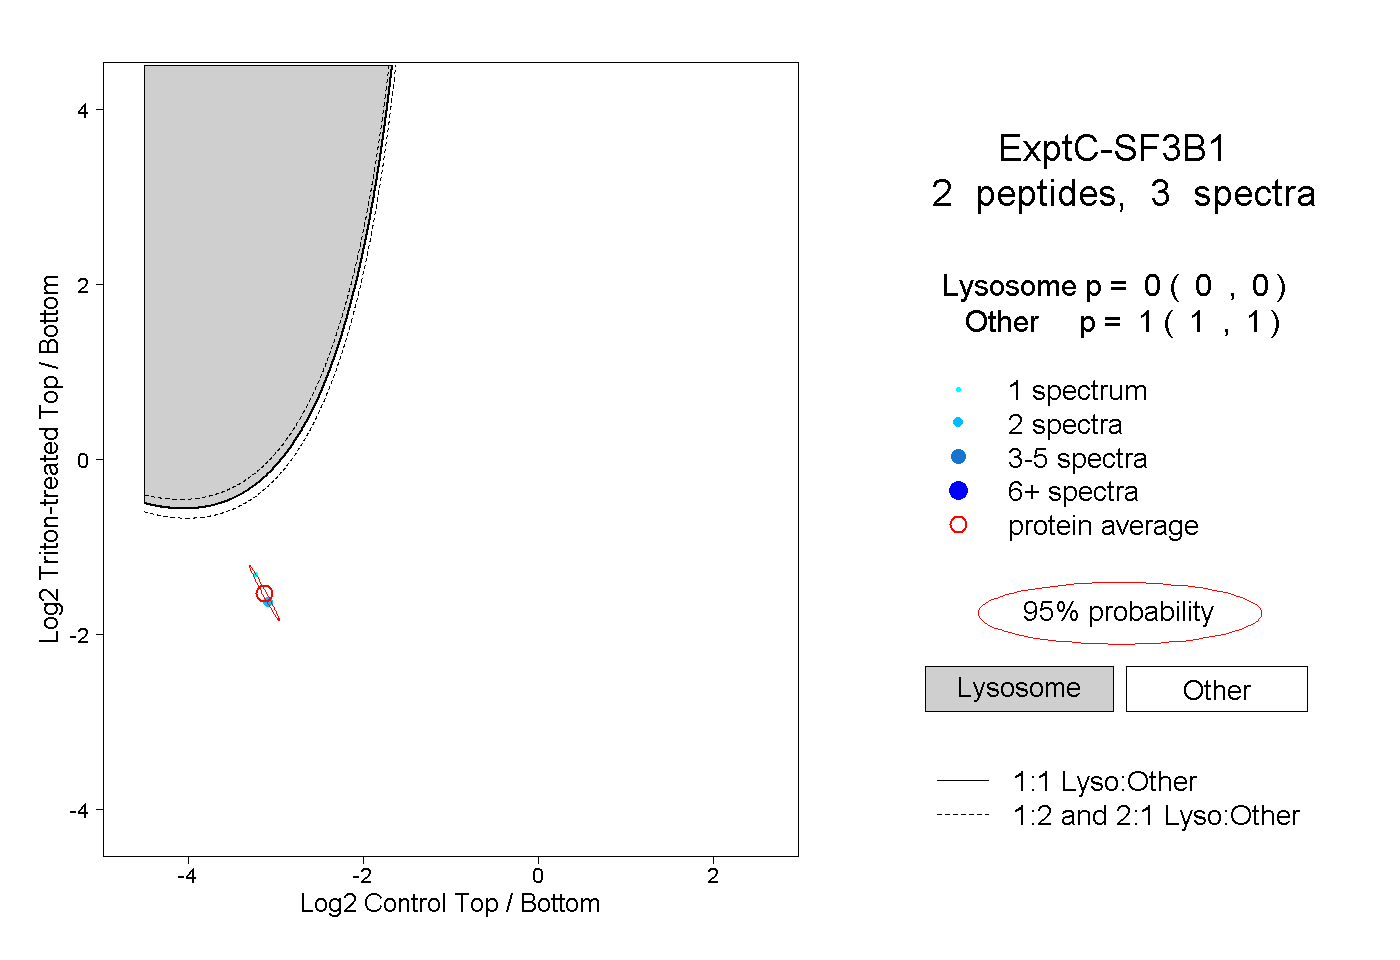
0.000 | 0.000
1.000 | 1.000