SF3B1
[ENSRNOP00000019126]
Main page
| | | Plot |
Mito |
Lyso |
|
Perox |
ER |
Golgi |
PM |
Cytosol |
Nucleus |
|
| Expt A |
 32
32
peptides |
72
spectra |
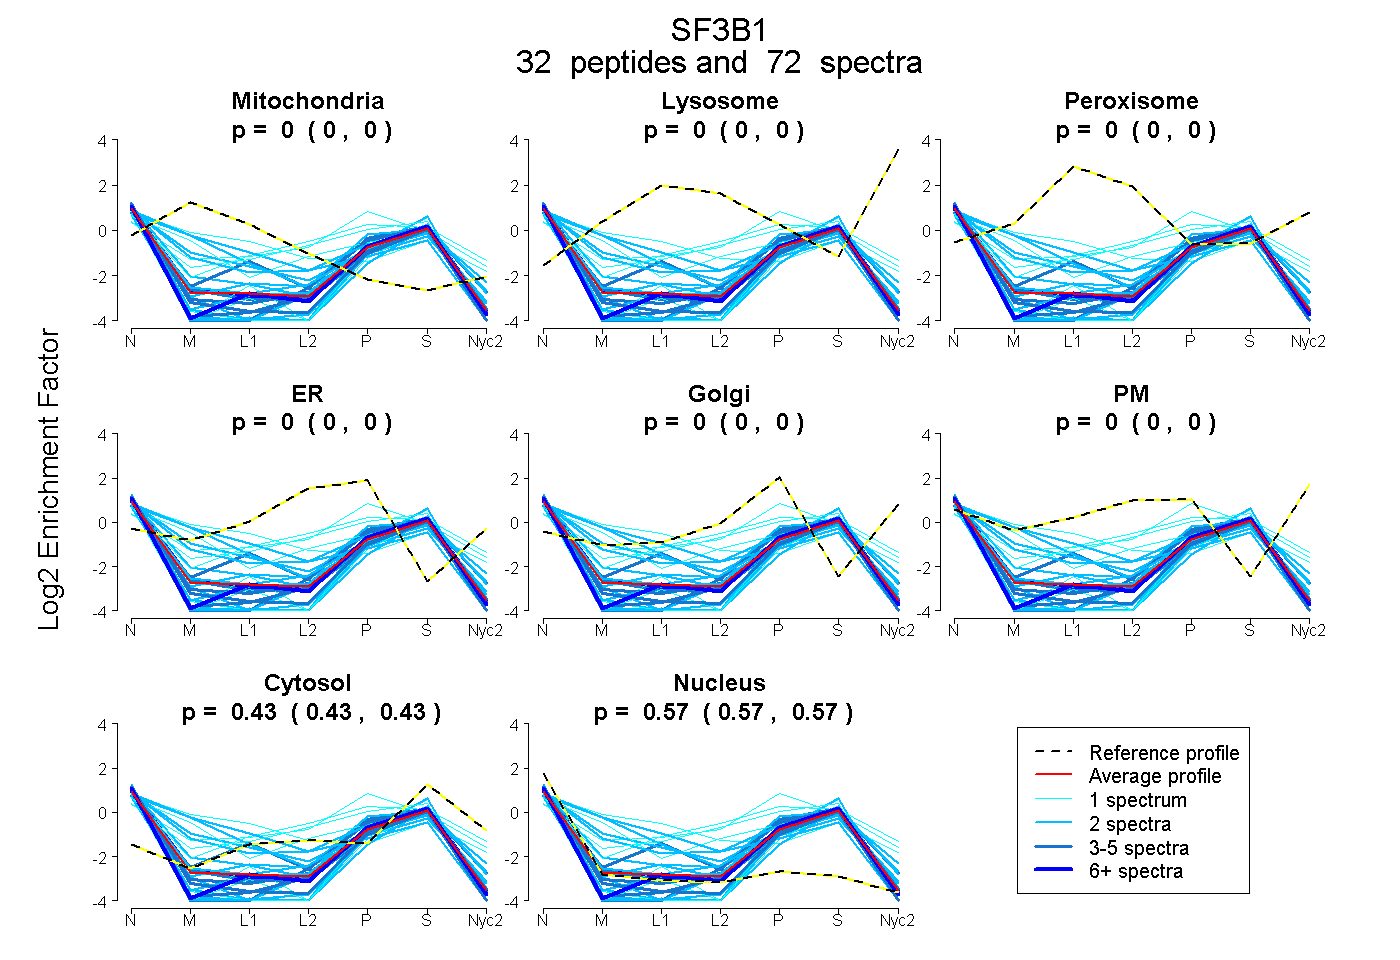 |
0.000
0.000 | 0.000 |
0.000
0.000 | 0.000 |
|
0.000
0.000 | 0.000 |
0.000
0.000 | 0.000 |
0.000
0.000 | 0.000 |
0.000
0.000 | 0.000 |
0.430
0.427 | 0.432 |
0.570
0.567 | 0.573 |
|
| | | Plot |
Mito |
|
Lyso or Perox |
|
ER |
Golgi |
PM |
Cytosol |
Nucleus |
|
| Expt B |
5
peptides |
5
spectra |
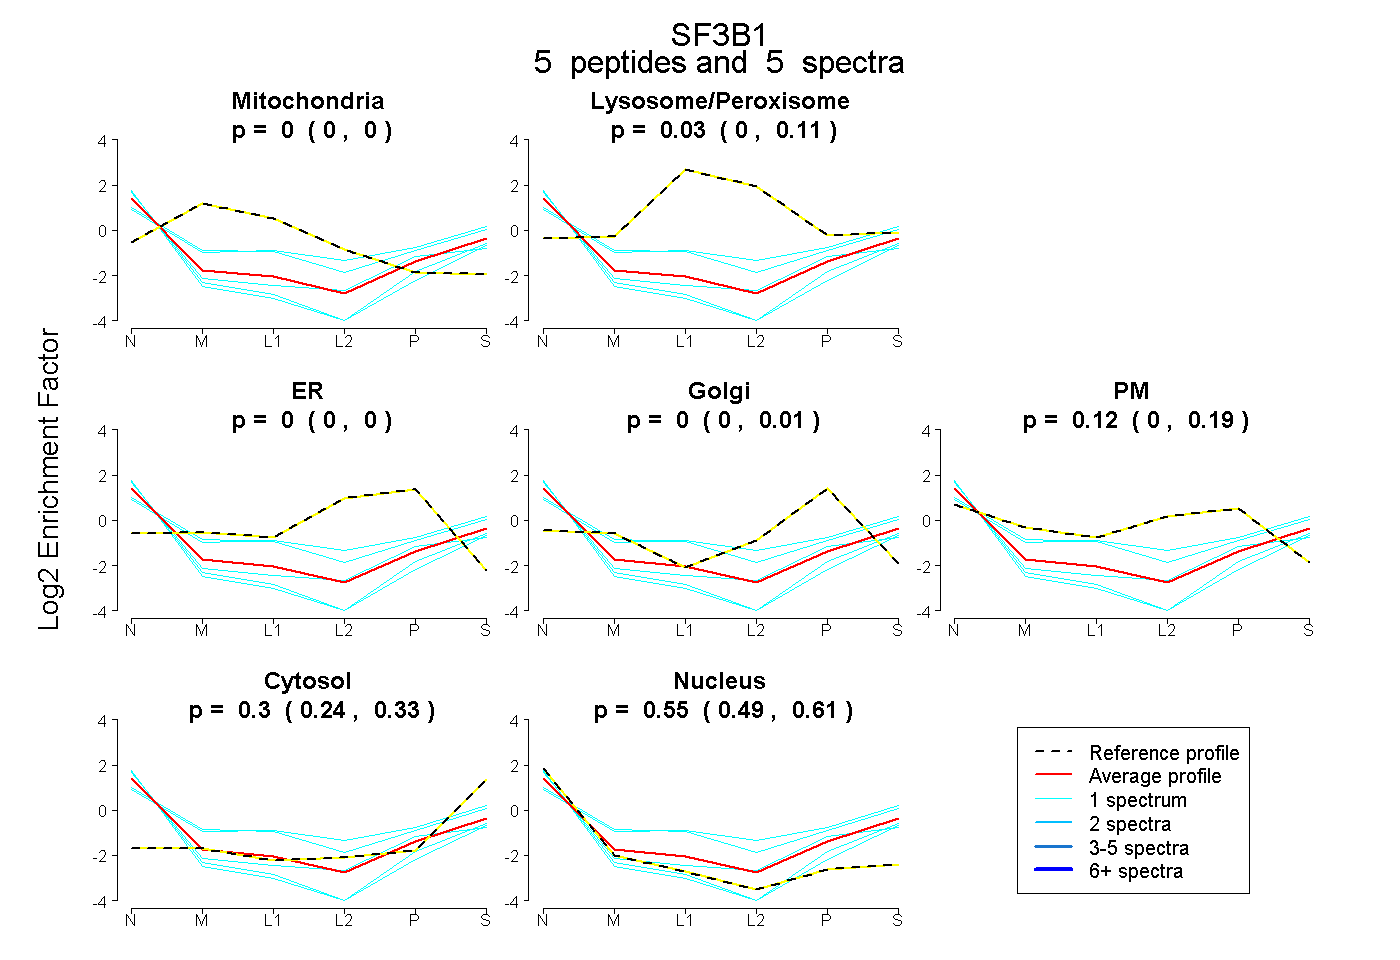 |
0.000
0.000 | 0.000 |
|
0.030
0.000 | 0.114 |
|
0.000
0.000 | 0.000 |
0.000
0.000 | 0.015 |
0.124
0.000 | 0.192 |
0.297
0.242 | 0.332 |
0.548
0.491 | 0.613 |
|
| 1 spectrum, GAEYVSAR |
0.000 |
|
0.000 |
|
0.000 |
0.000 |
0.000 |
0.238 |
0.762 |
|
| 1 spectrum, AIVNVIGMHK |
0.000 |
|
0.211 |
|
0.000 |
0.000 |
0.233 |
0.305 |
0.251 |
|
| 1 spectrum, VQENCIDLVGR |
0.000 |
|
0.000 |
|
0.000 |
0.000 |
0.000 |
0.203 |
0.797 |
|
| 1 spectrum, LDDLVRPYVHK |
0.000 |
|
0.210 |
|
0.000 |
0.000 |
0.167 |
0.282 |
0.342 |
|
| 1 spectrum, ICFELLELLK |
0.000 |
|
0.000 |
|
0.000 |
0.050 |
0.139 |
0.208 |
0.603 |
|
| | | Plot |
|
Lyso |
|
|
|
|
|
|
|
Other |
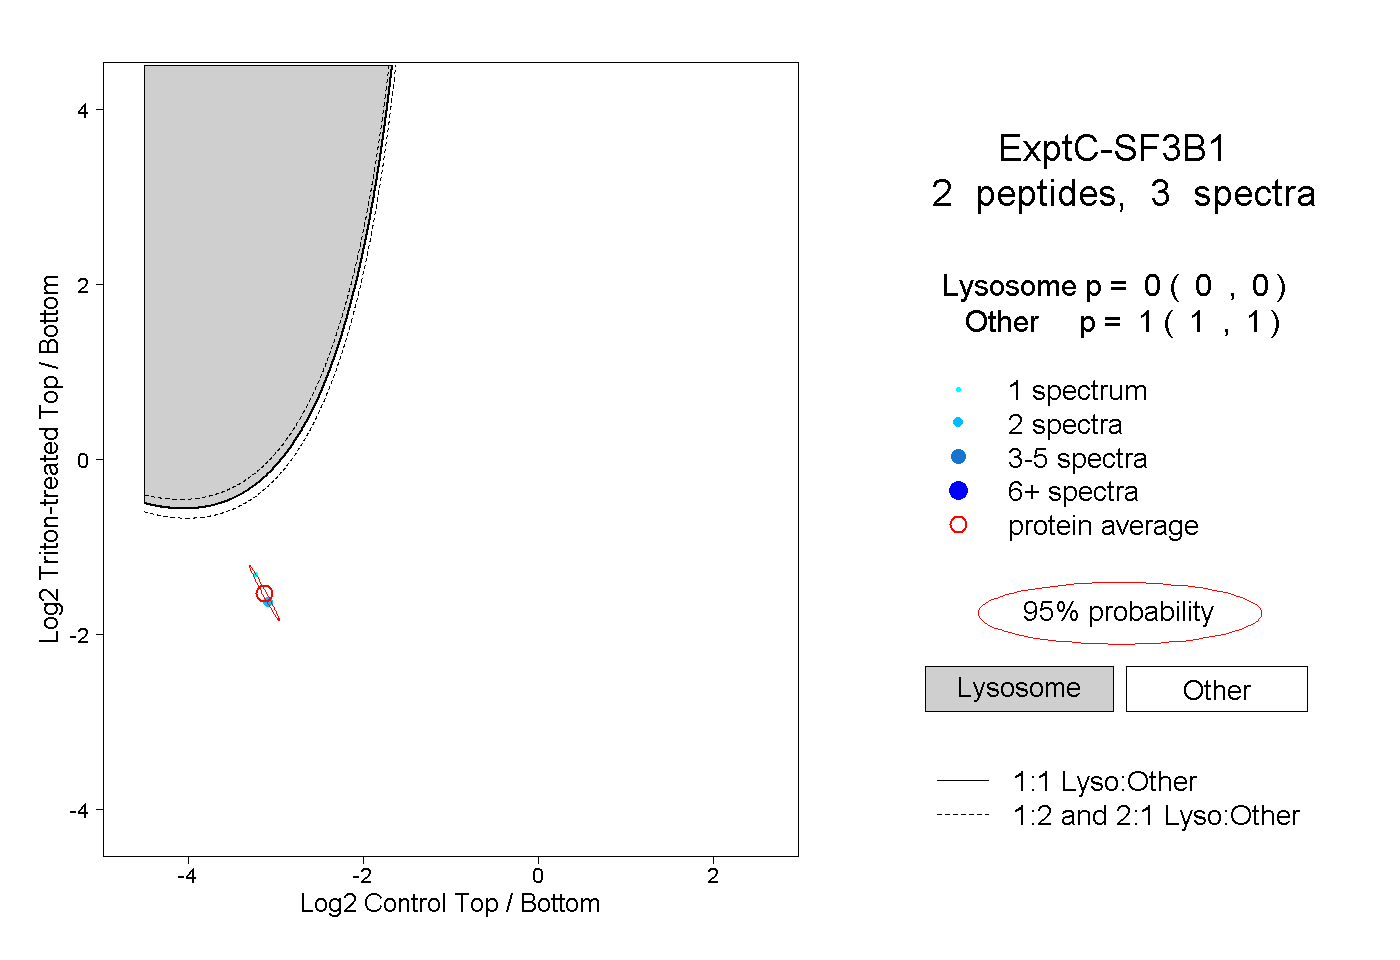
| Expt C |
2
peptides |
3
spectra |
 |
|
0.000
0.000 | 0.000 |
|
|
|
|
|
|
|
1.000
1.000 | 1.000 |