 4
4peptides
spectra
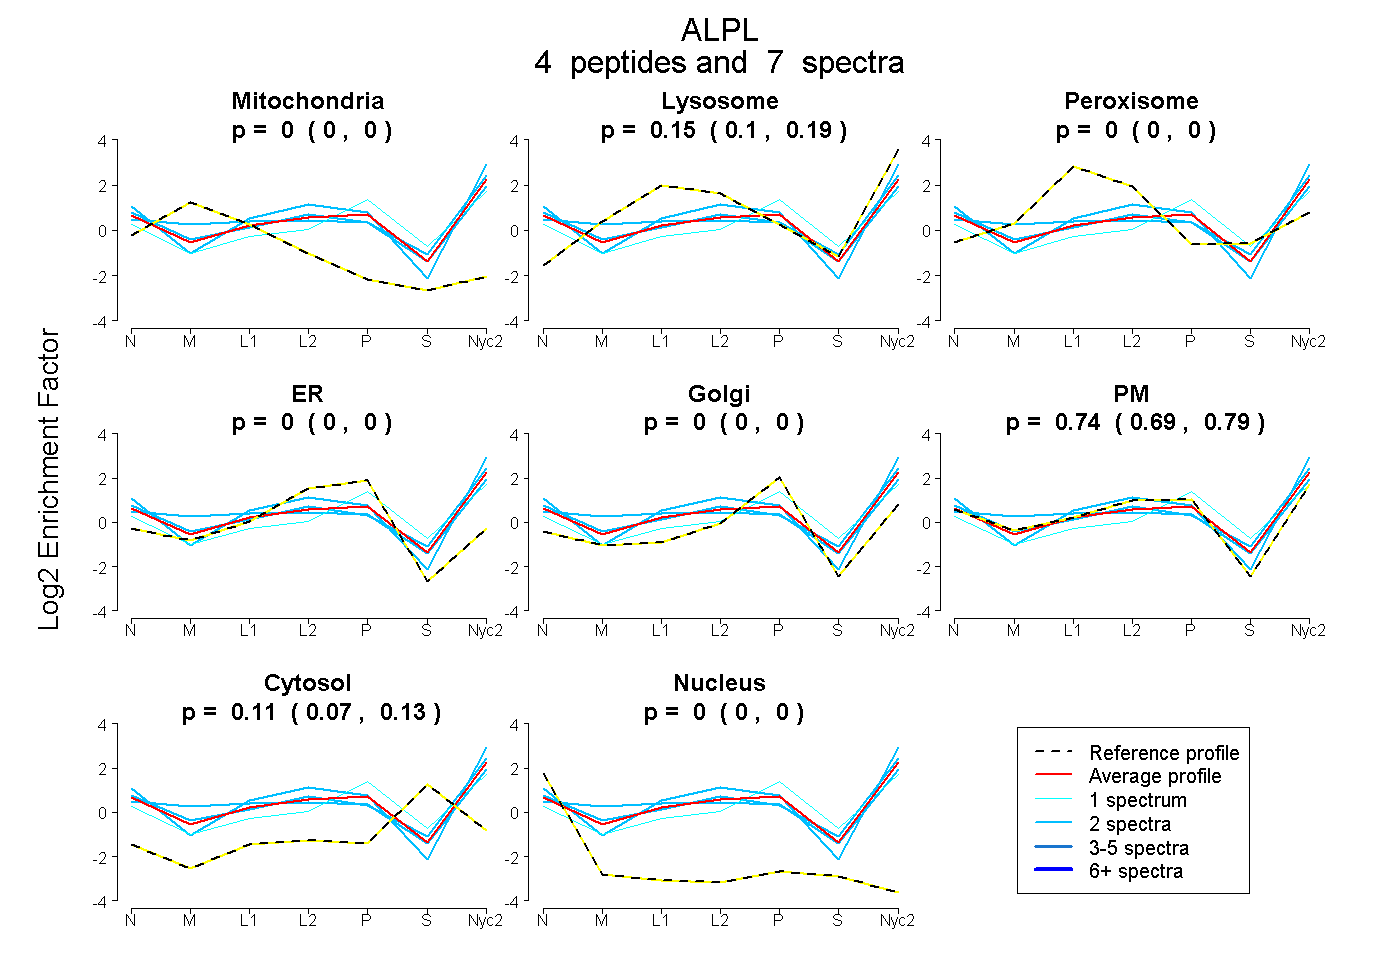
0.000 | 0.000
0.104 | 0.190
0.000 | 0.000
0.000 | 0.000
0.000 | 0.000
0.688 | 0.791
0.075 | 0.131
0.000 | 0.000
7peptides
spectra
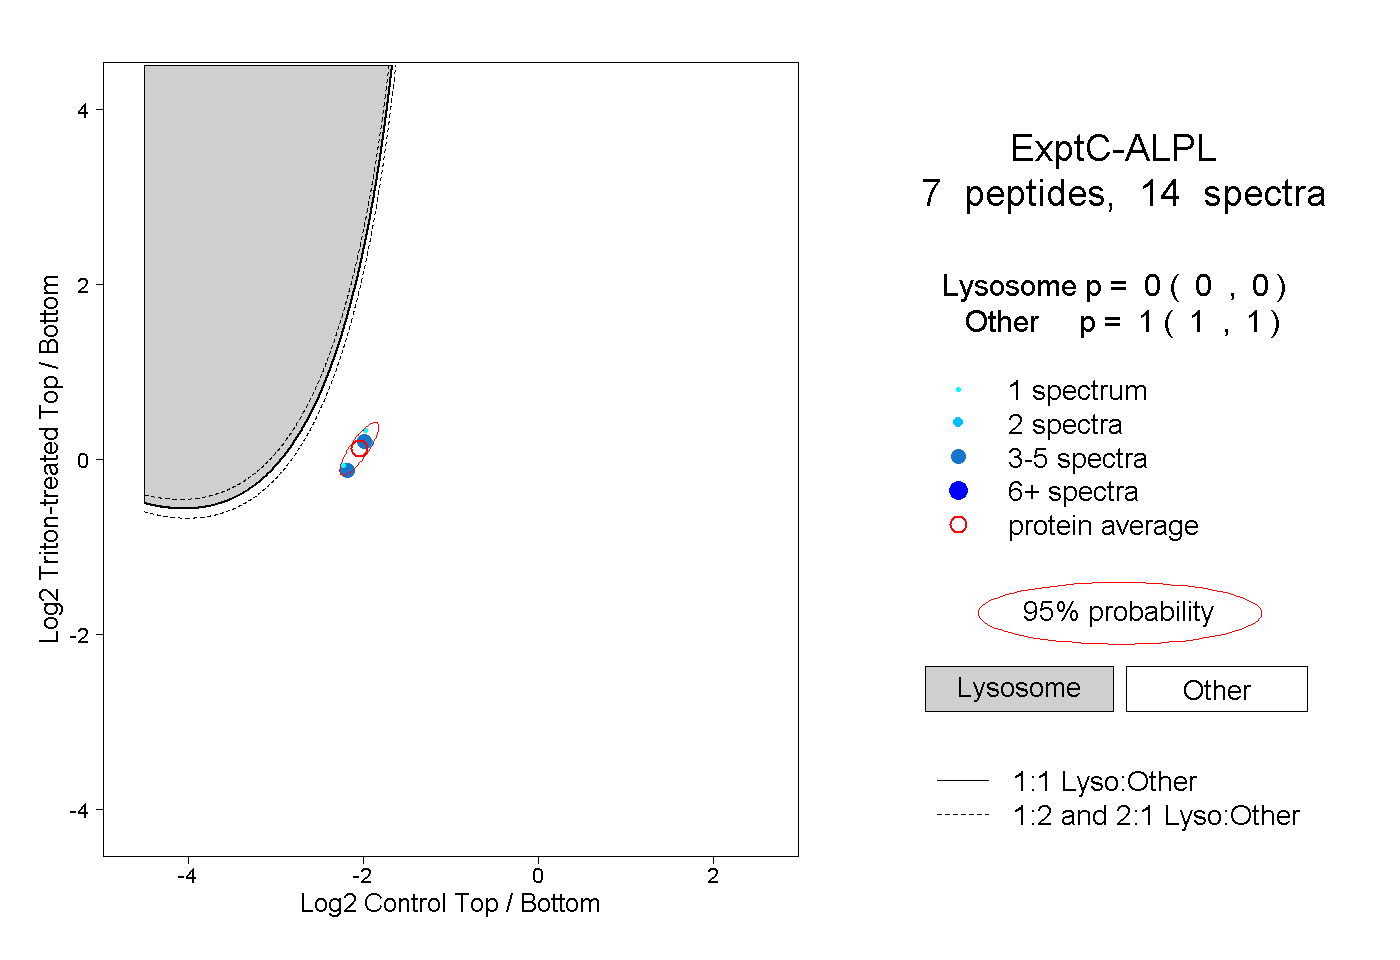
0.000 | 0.000
1.000 | 1.000
2peptides
spectra
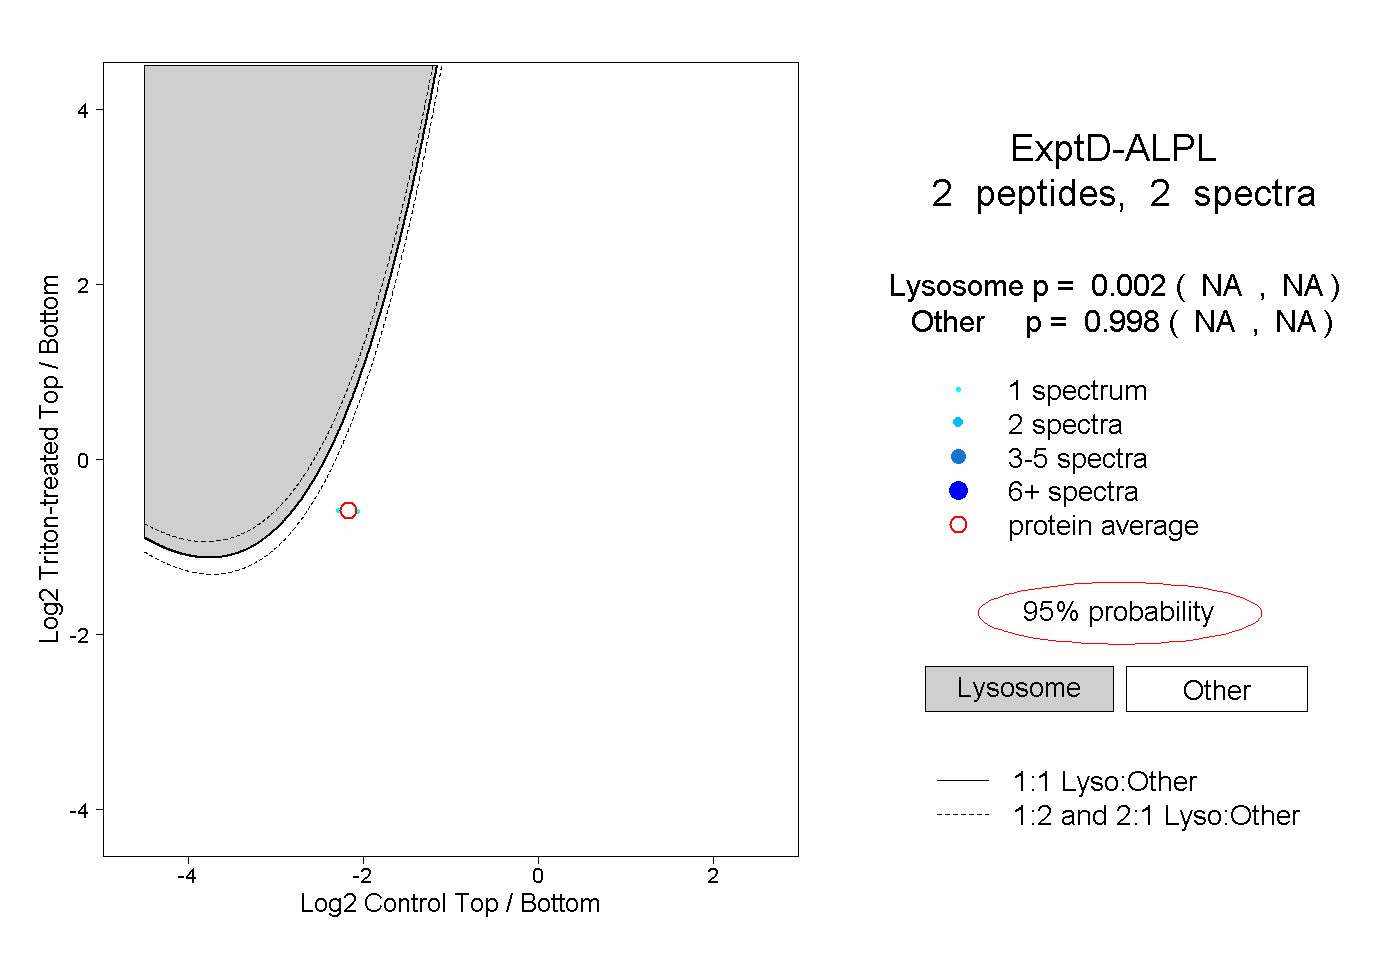
NA | NA
NA | NA