 4
4peptides
spectra
0.000 | 0.000
0.104 | 0.190
0.000 | 0.000
0.000 | 0.000
0.000 | 0.000
0.688 | 0.791
0.075 | 0.131
0.000 | 0.000
| Plot | Mito | Lyso | Perox | ER | Golgi | PM | Cytosol | Nucleus | |||||
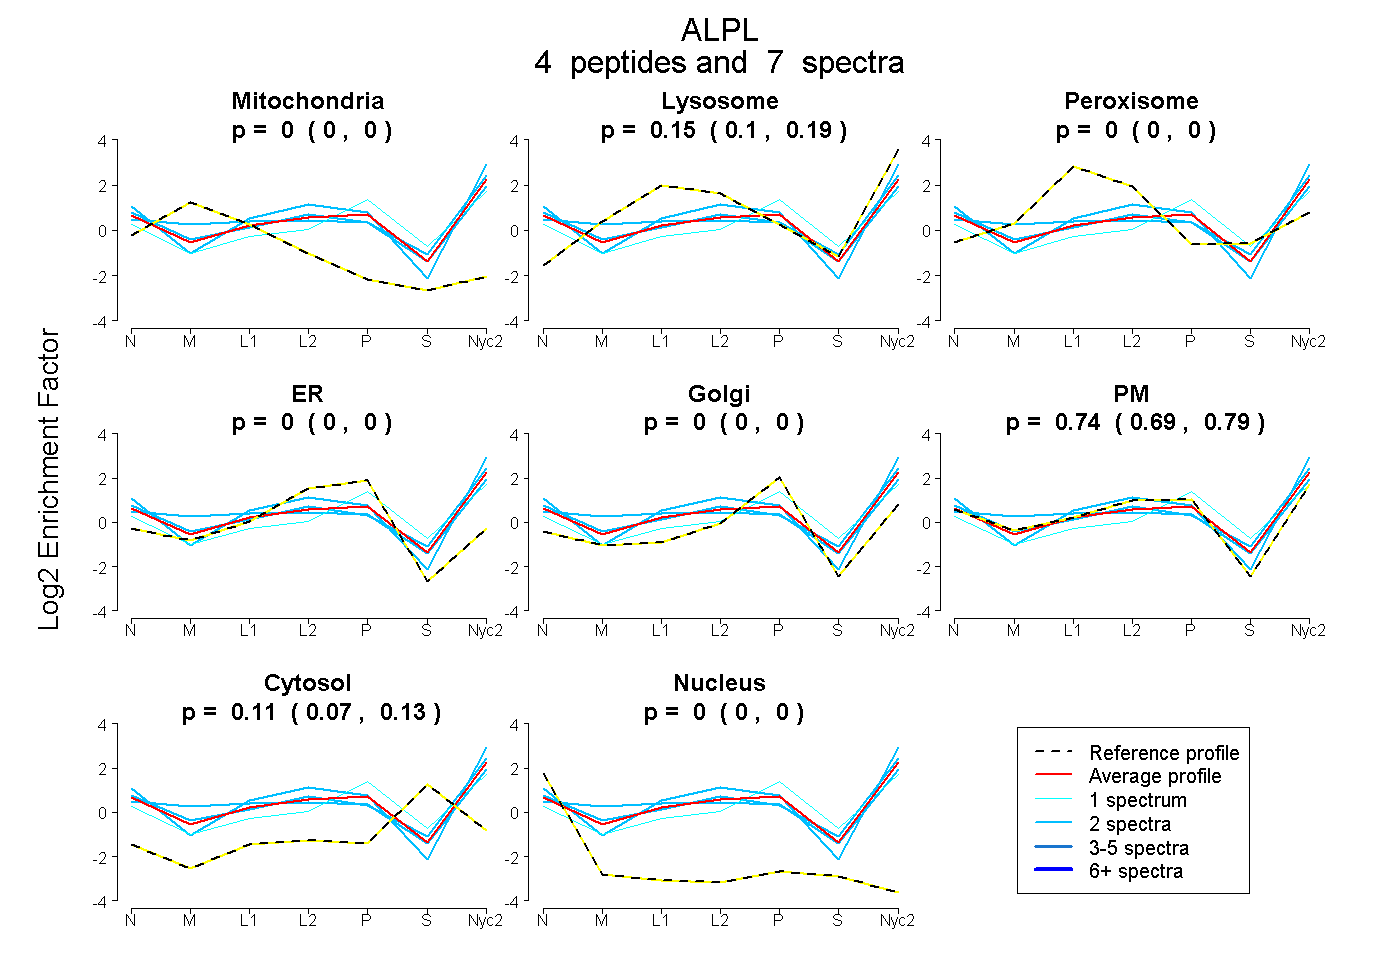
| Expt A |
4 peptides |
7 spectra |
|
0.000 0.000 | 0.000 |
0.150 0.104 | 0.190 |
0.000 0.000 | 0.000 |
0.000 0.000 | 0.000 |
0.000 0.000 | 0.000 |
0.744 0.688 | 0.791 |
0.106 0.075 | 0.131 |
0.000 0.000 | 0.000 |
| 2 spectra, SVGIVTTTR | 0.000 | 0.207 | 0.000 | 0.000 | 0.000 | 0.668 | 0.125 | 0.000 | ||
| 2 spectra, DIDVIMGGGR | 0.082 | 0.228 | 0.000 | 0.000 | 0.000 | 0.616 | 0.073 | 0.000 | ||
| 1 spectrum, TDVEYELDEK | 0.000 | 0.111 | 0.000 | 0.000 | 0.274 | 0.418 | 0.197 | 0.000 | ||
| 2 spectra, GFFLLVEGGR | 0.000 | 0.140 | 0.000 | 0.000 | 0.000 | 0.860 | 0.000 | 0.000 |
| Plot | Lyso | Other | |||||||||||
| Expt C |
7 peptides |
14 spectra |
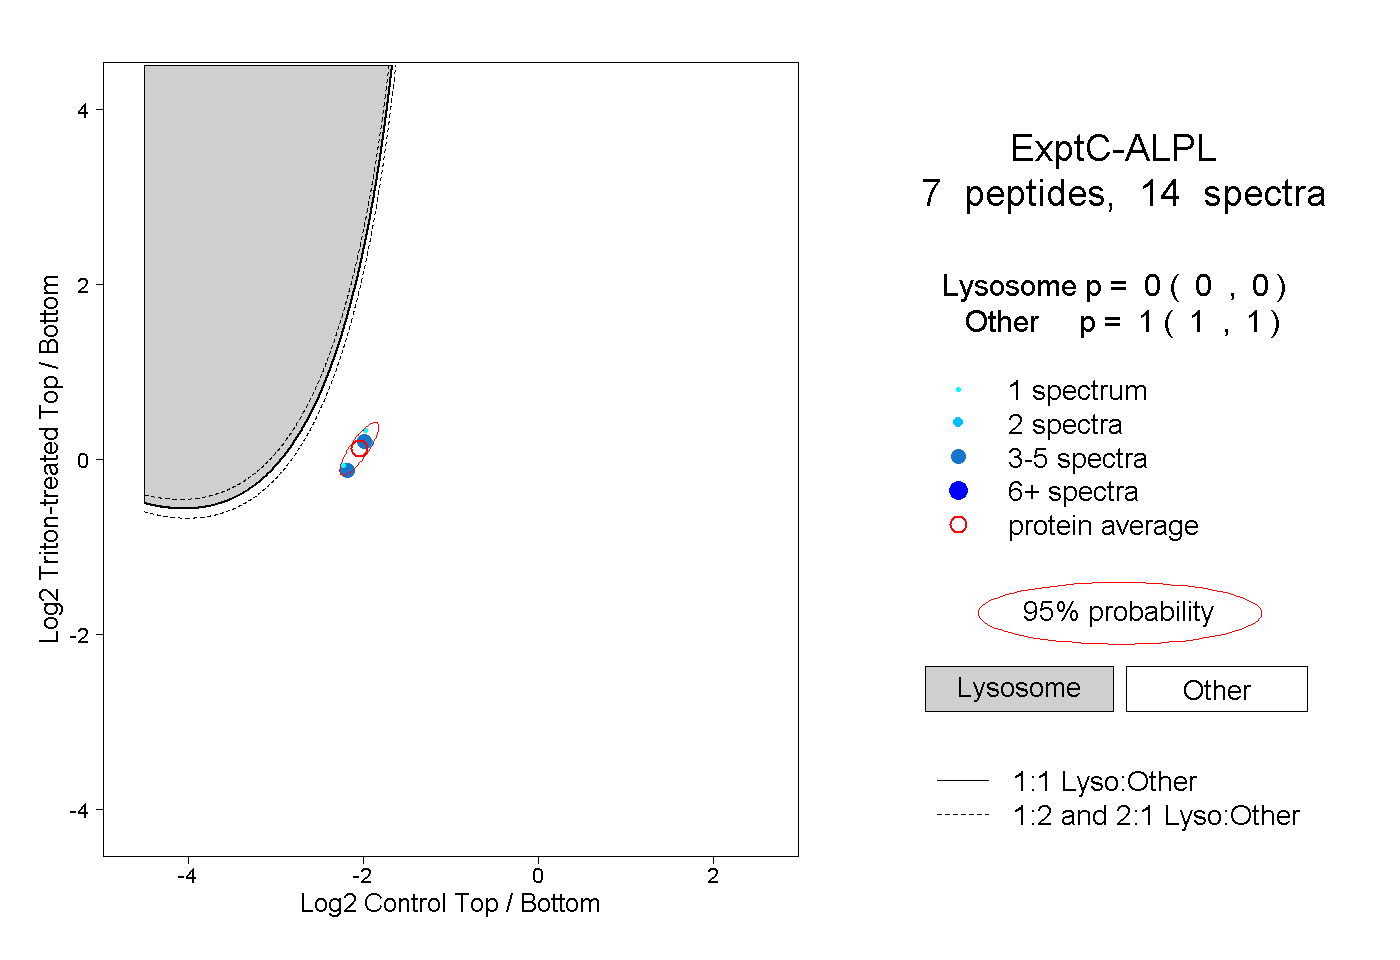 |
0.000 0.000 | 0.000 |
1.000 1.000 | 1.000 |
||||||||
| Plot | Lyso | Other | |||||||||||
| Expt D |
2 peptides |
2 spectra |
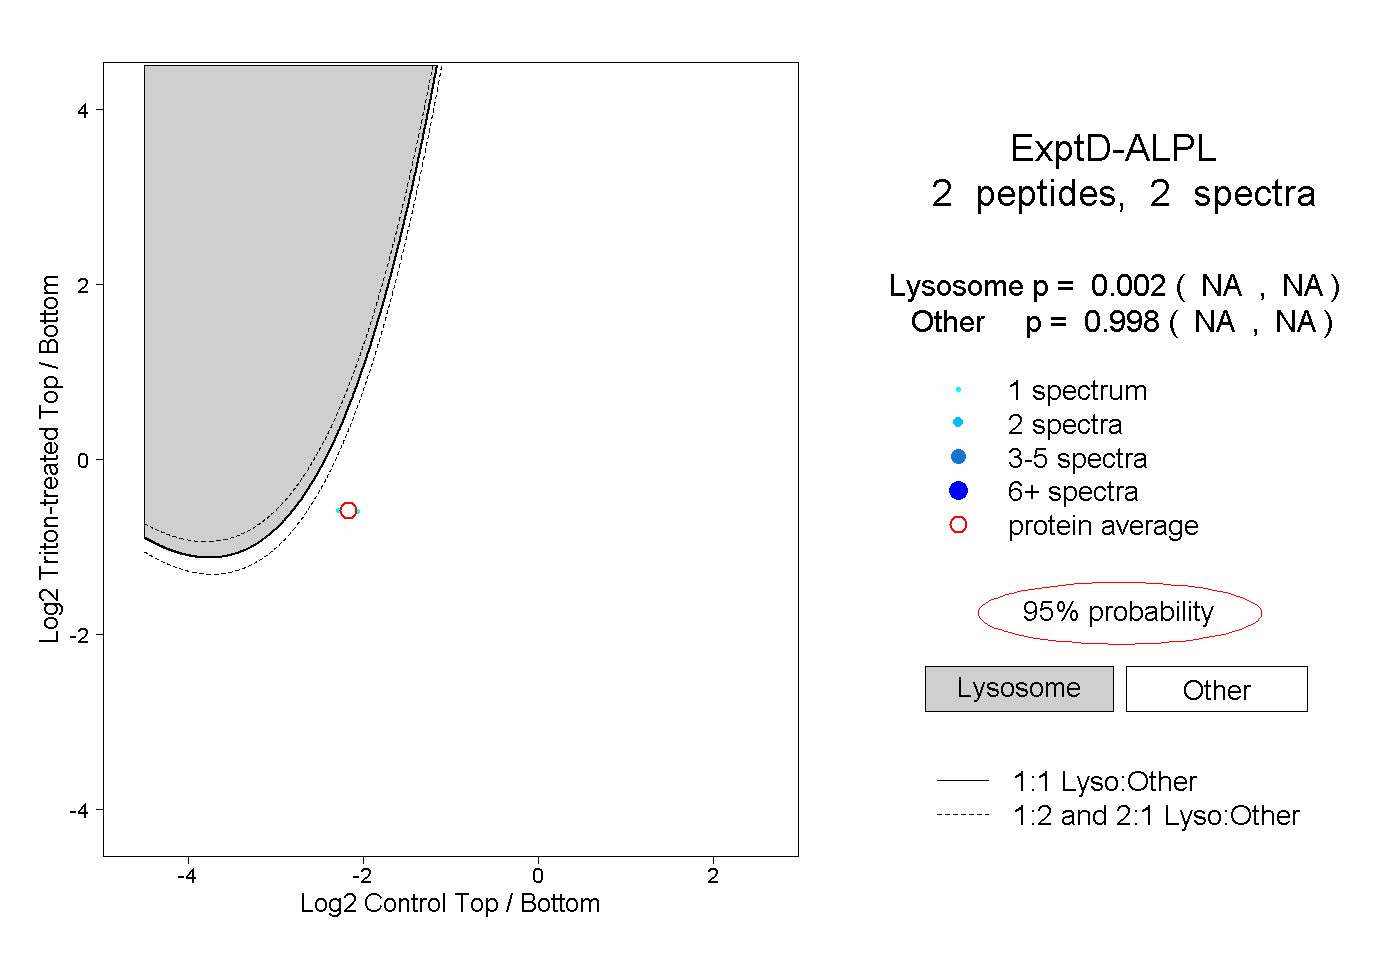 |
0.002 NA | NA |
0.998 NA | NA |