 2
2peptides
spectra
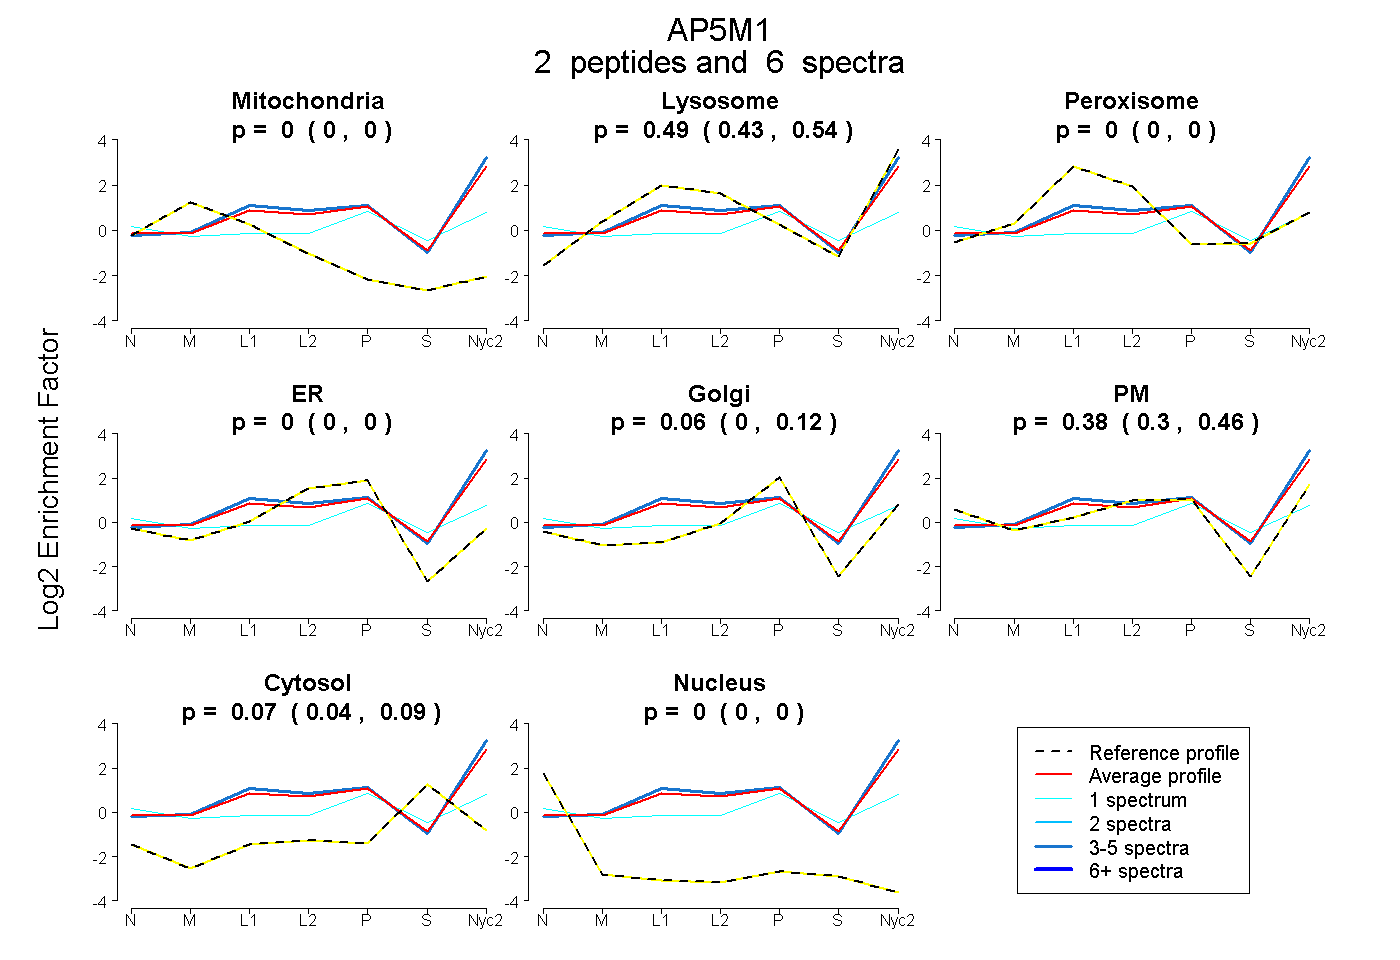
0.000 | 0.000
0.428 | 0.539
0.000 | 0.000
0.000 | 0.000
0.000 | 0.123
0.297 | 0.456
0.036 | 0.093
0.000 | 0.000
1peptide
spectra
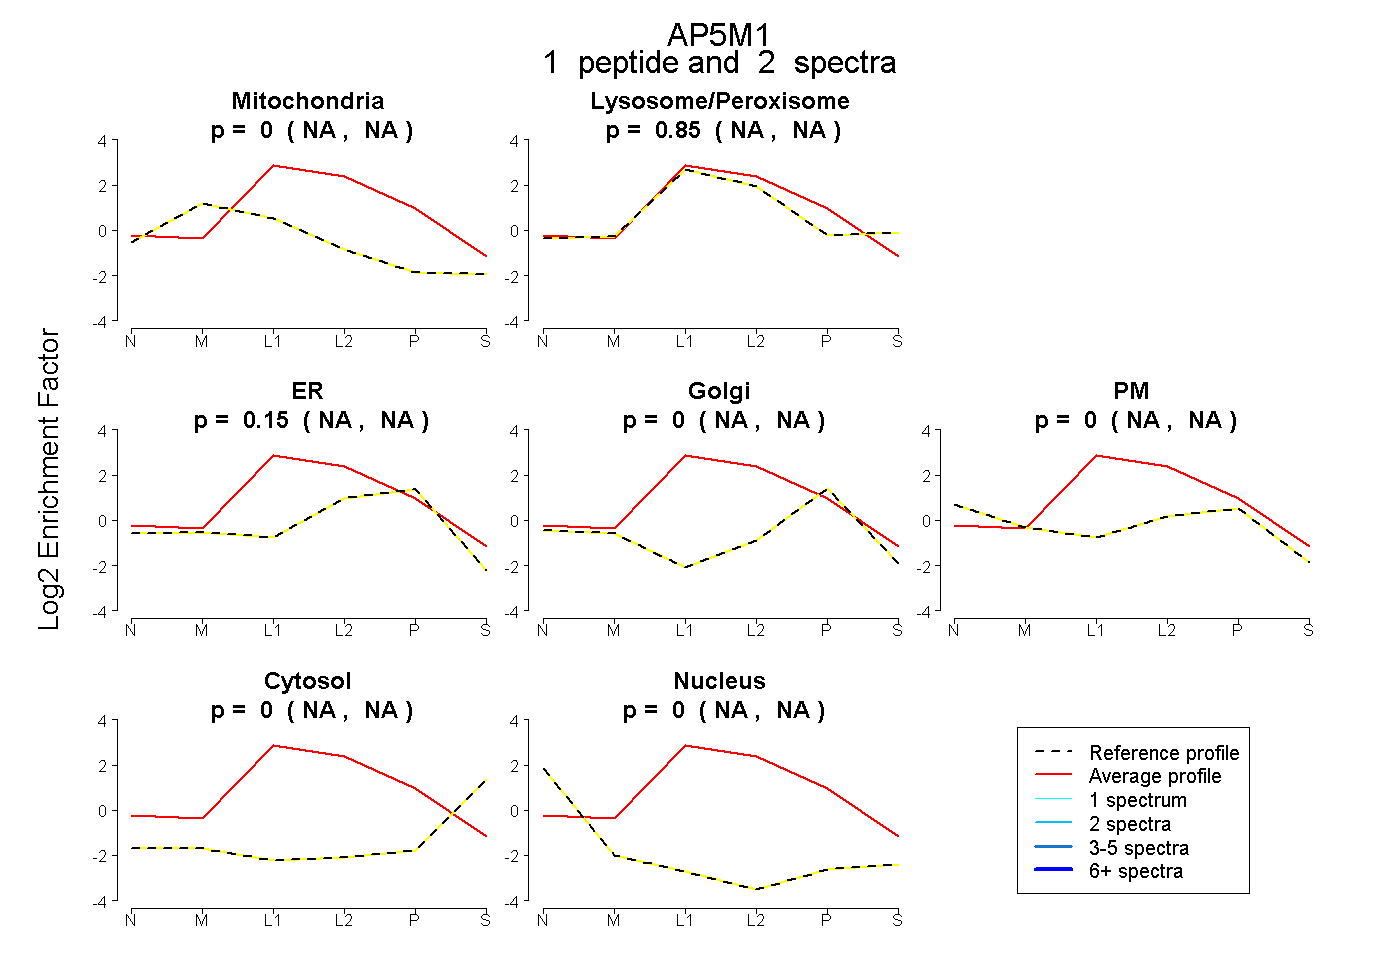
NA | NA
NA | NA
NA | NA
NA | NA
NA | NA
NA | NA
NA | NA
8peptides
spectra
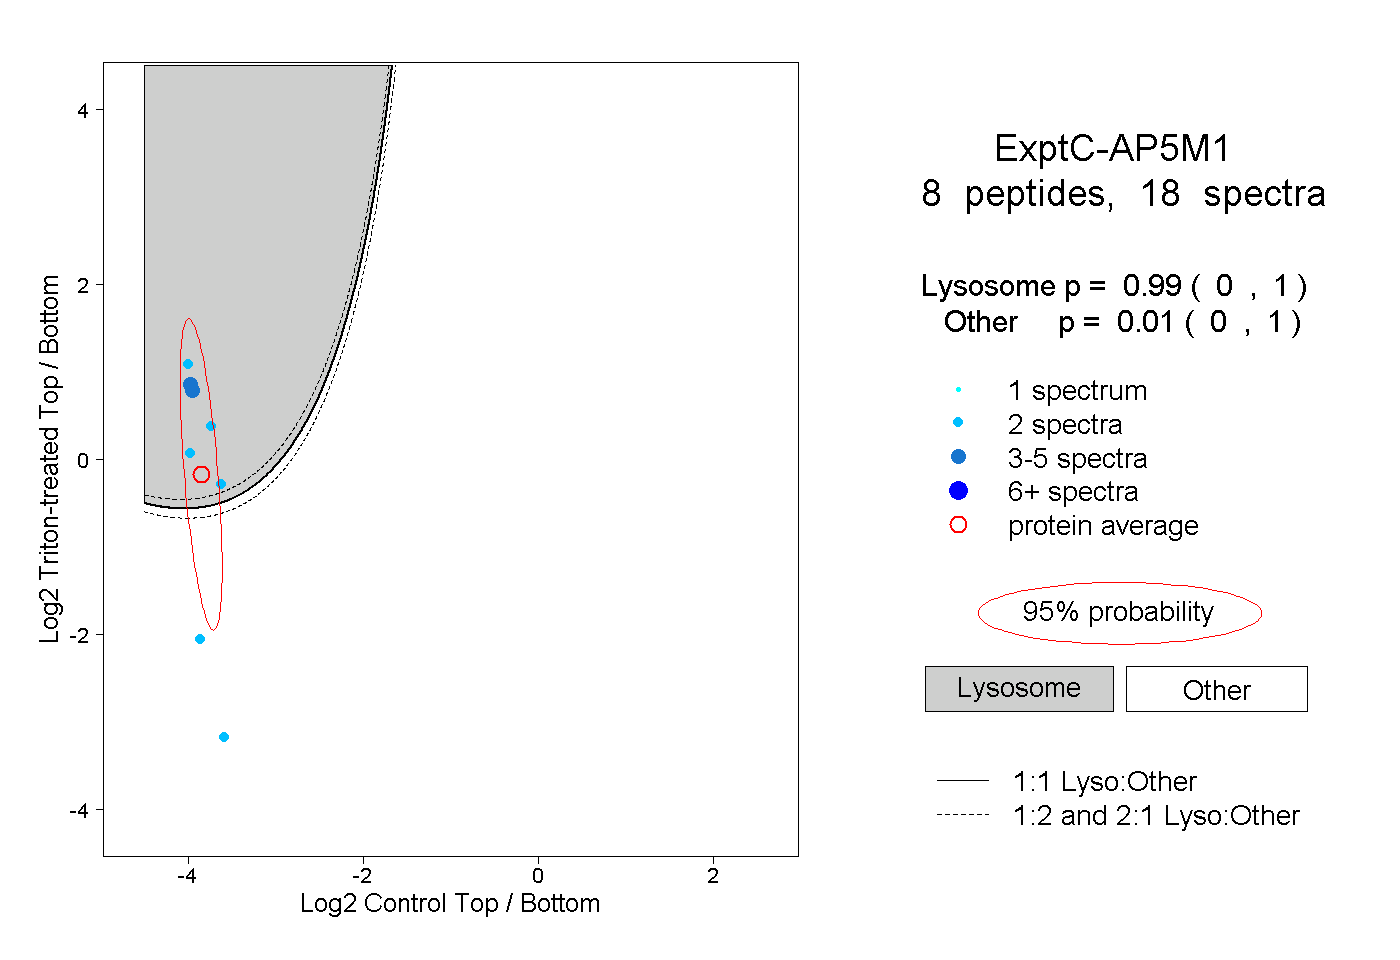
0.000 | 1.000
0.000 | 1.000