 2
2peptides
spectra
0.000 | 0.000
0.428 | 0.539
0.000 | 0.000
0.000 | 0.000
0.000 | 0.123
0.297 | 0.456
0.036 | 0.093
0.000 | 0.000
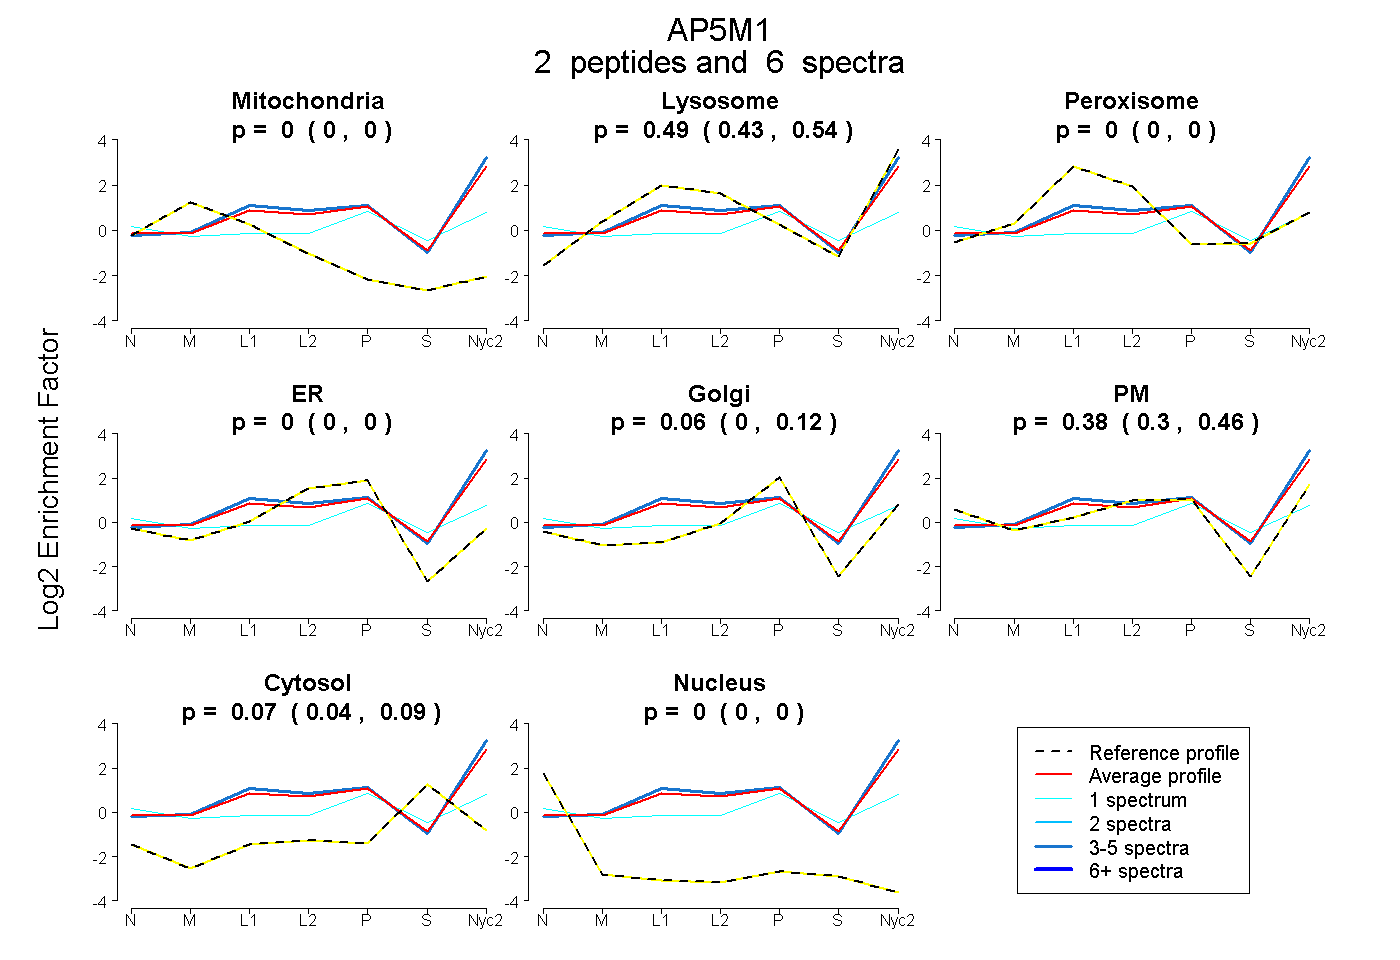
| Plot | Mito | Lyso | Perox | ER | Golgi | PM | Cytosol | Nucleus | |||||
| Expt A |
2 peptides |
6 spectra |
|
0.000 0.000 | 0.000 |
0.490 0.428 | 0.539 |
0.000 0.000 | 0.000 |
0.000 0.000 | 0.000 |
0.063 0.000 | 0.123 |
0.381 0.297 | 0.456 |
0.066 0.036 | 0.093 |
0.000 0.000 | 0.000 |
| 5 spectra, ALLFQLR | 0.000 | 0.576 | 0.000 | 0.000 | 0.062 | 0.346 | 0.016 | 0.000 | ||
| 1 spectrum, HEPGTPLGGTVK | 0.000 | 0.000 | 0.128 | 0.000 | 0.188 | 0.412 | 0.272 | 0.000 |
| Plot | Mito | Lyso or Perox | ER | Golgi | PM | Cytosol | Nucleus | ||||||
| Expt B |
1 peptide |
2 spectra |
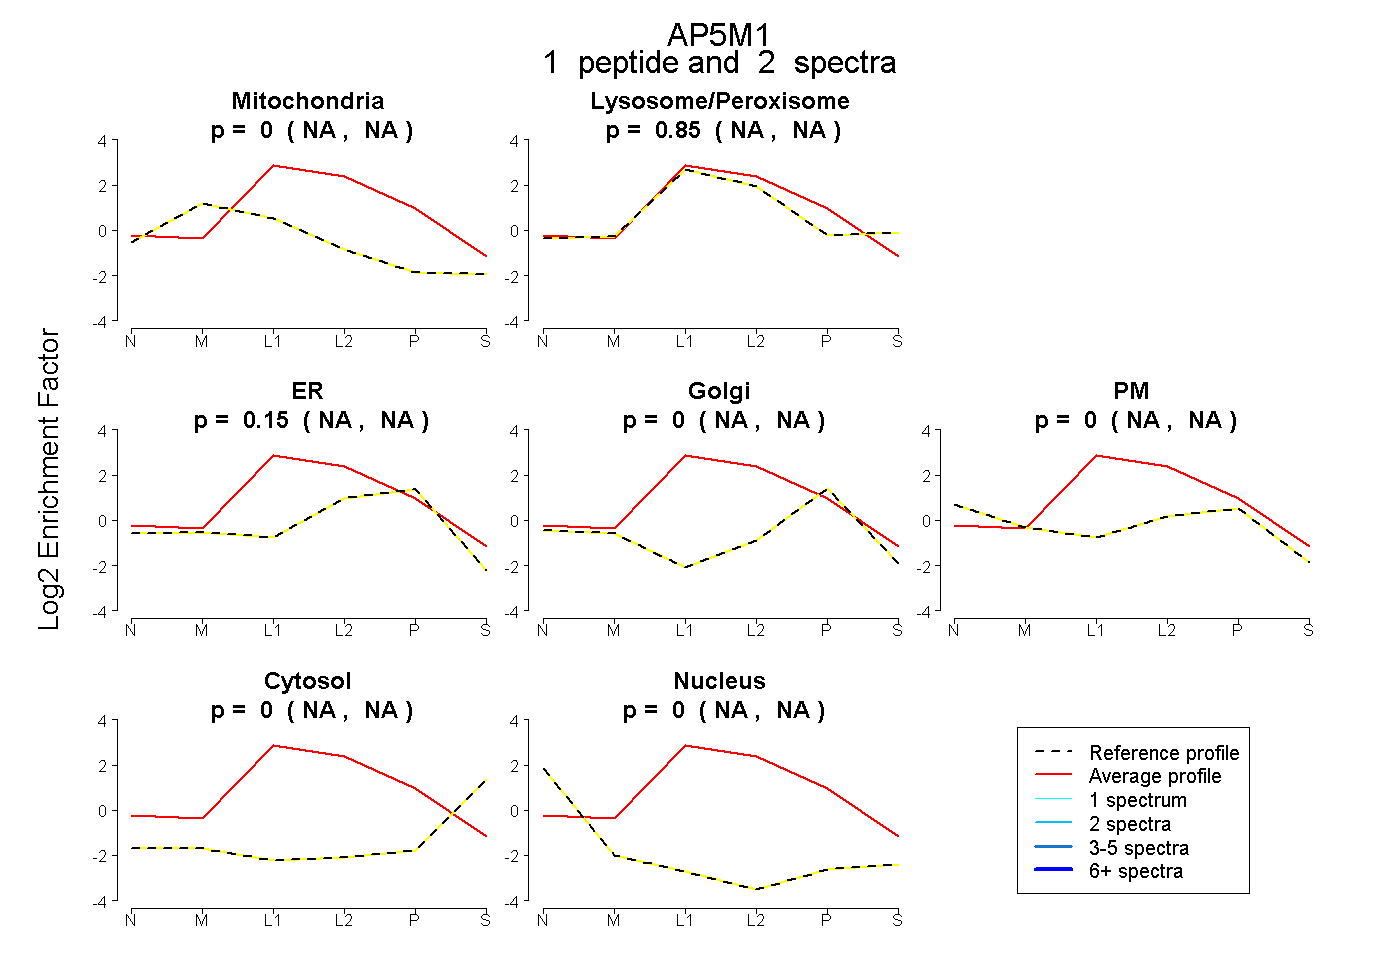 |
0.000 NA | NA |
0.845 NA | NA |
0.155 NA | NA |
0.000 NA | NA |
0.000 NA | NA |
0.000 NA | NA |
0.000 NA | NA |
|||
| Plot | Lyso | Other | |||||||||||
| Expt C |
8 peptides |
18 spectra |
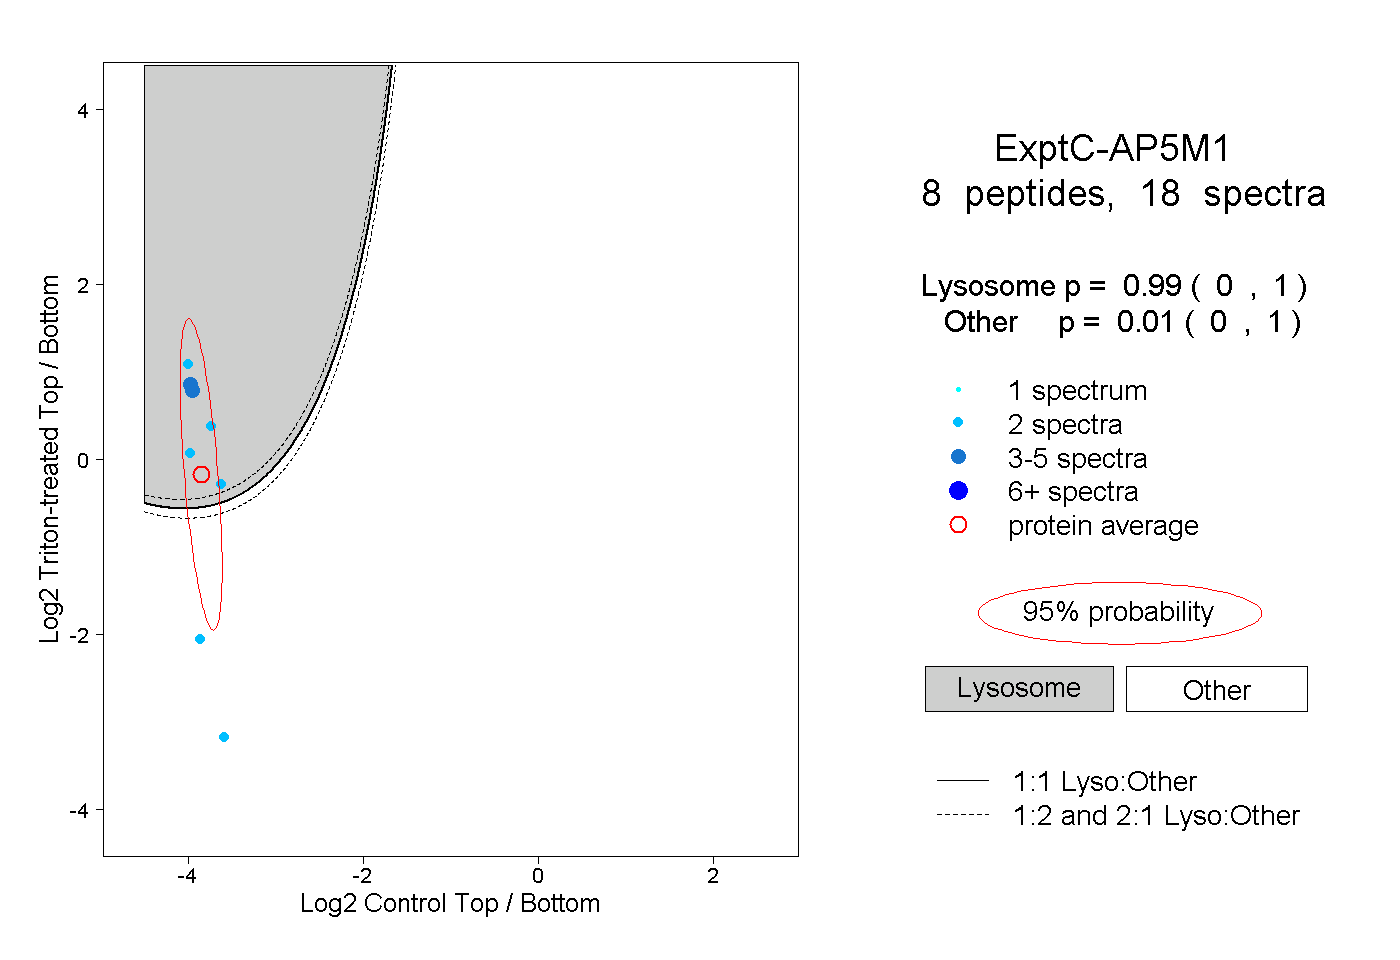 |
0.990 0.000 | 1.000 |
0.010 0.000 | 1.000 |