 28
28peptides
spectra
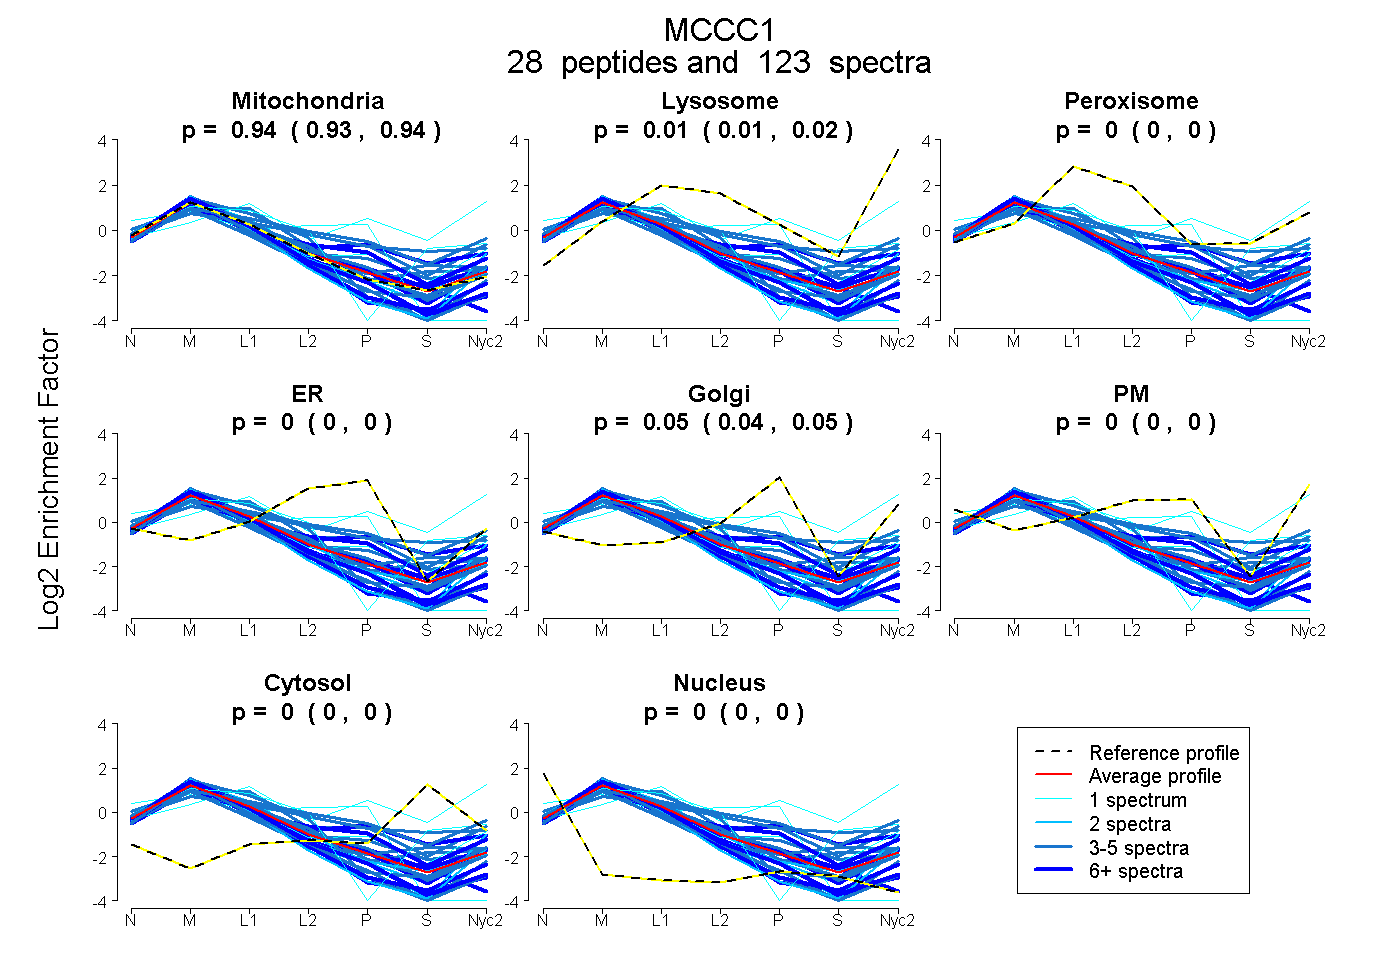
0.934 | 0.943
0.007 | 0.016
0.000 | 0.000
0.000 | 0.003
0.043 | 0.053
0.000 | 0.000
0.000 | 0.000
0.000 | 0.000
19peptides
spectra
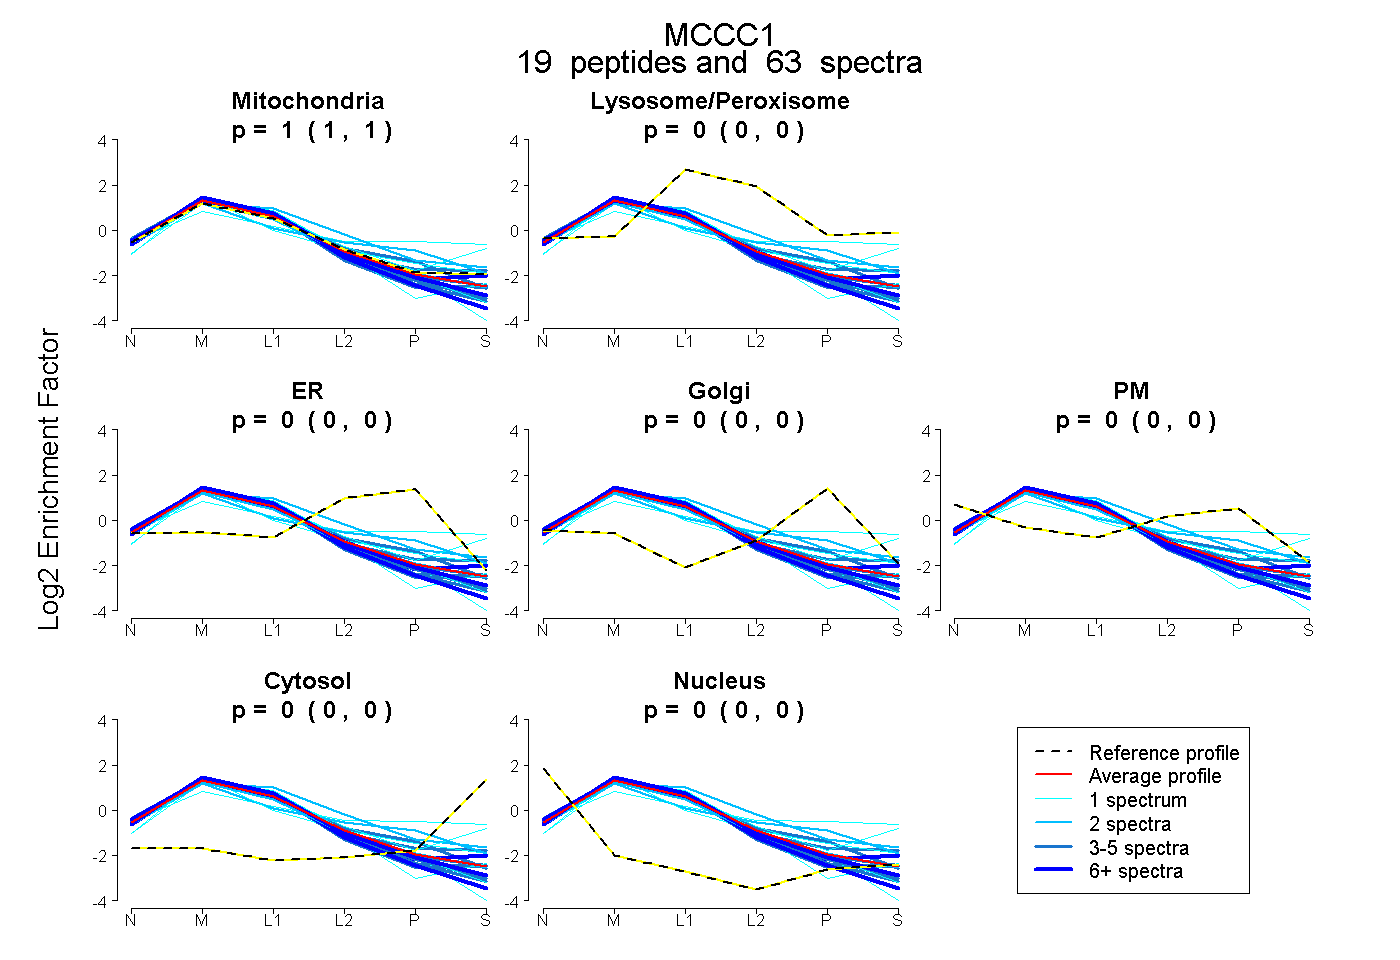
1.000 | 1.000
0.000 | 0.000
0.000 | 0.000
0.000 | 0.000
0.000 | 0.000
0.000 | 0.000
0.000 | 0.000
31peptides
spectra
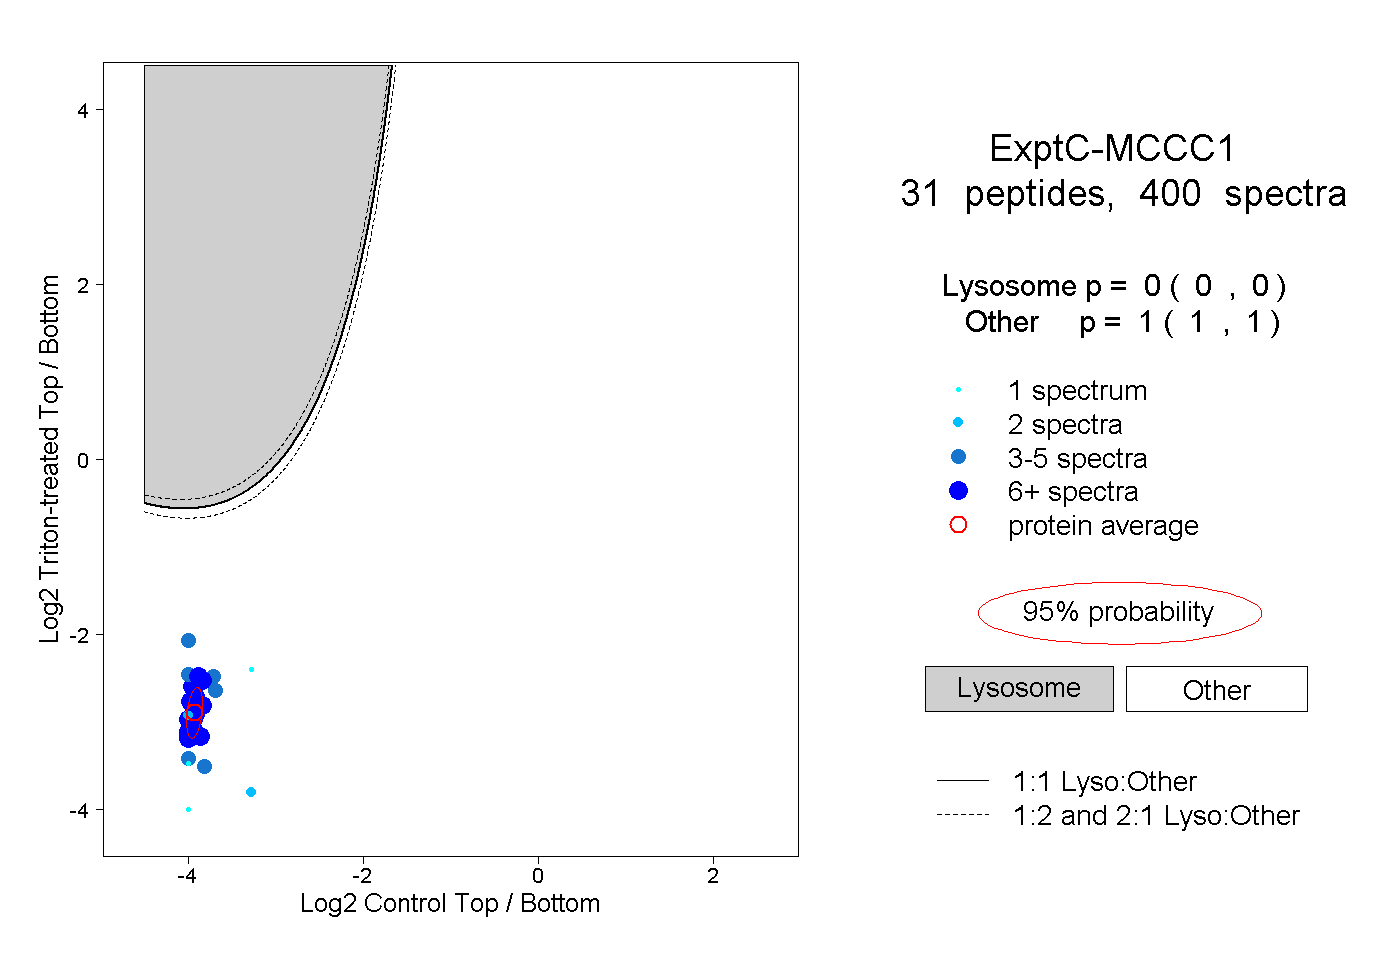
0.000 | 0.000
1.000 | 1.000
18peptides
spectra
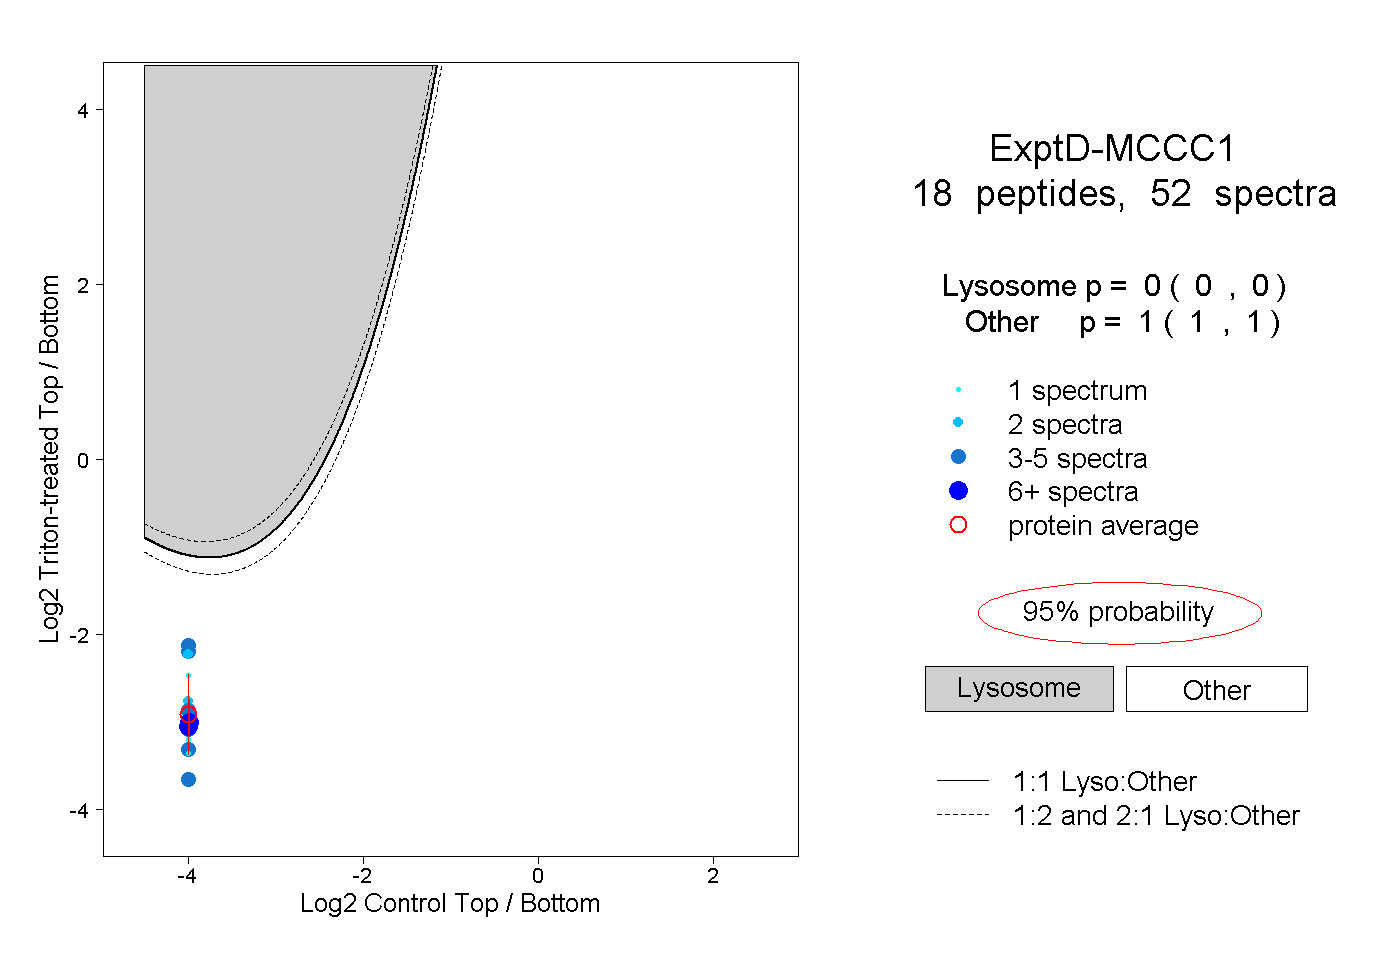
0.000 | 0.000
1.000 | 1.000